 ETW

Most traders learn what a fair value gap is in five minutes and then spend months losing money on them. The problem is not the definition. It is that they trade every gap on every chart, in both directions, with no idea which ones matter.
This post keeps it tight. One job, continuation trades, and three timeframes that each do one thing: H4 for direction and the zone, H1 for confirmation, M15 for the entry. Same idea as our simple order block model: few rules, clear entry, clear stop, clear target, so you can trade it, journal it and find out if it works for you.
What a continuation FVG means in this model
Here is the definition we will use:
A continuation FVG is the gap between candle 1's wick and candle 3's wick, left behind by a displacement candle that breaks structure in the direction of the trend.
A fair value gap is a three-candle pattern. The middle candle moves so fast that the wicks of the candles on either side of it do not overlap, and that empty space is the gap.
- Bullish FVG: the space between the high of candle 1 and the low of candle 3. In an uptrend, this is where you look to buy.
- Bearish FVG: the space between the low of candle 1 and the high of candle 3. In a downtrend, this is where you look to sell.
Mark the 50% line through the middle of the gap. That midpoint is called consequent encroachment (CE), and it matters for both the entry and for judging whether the gap is still healthy.
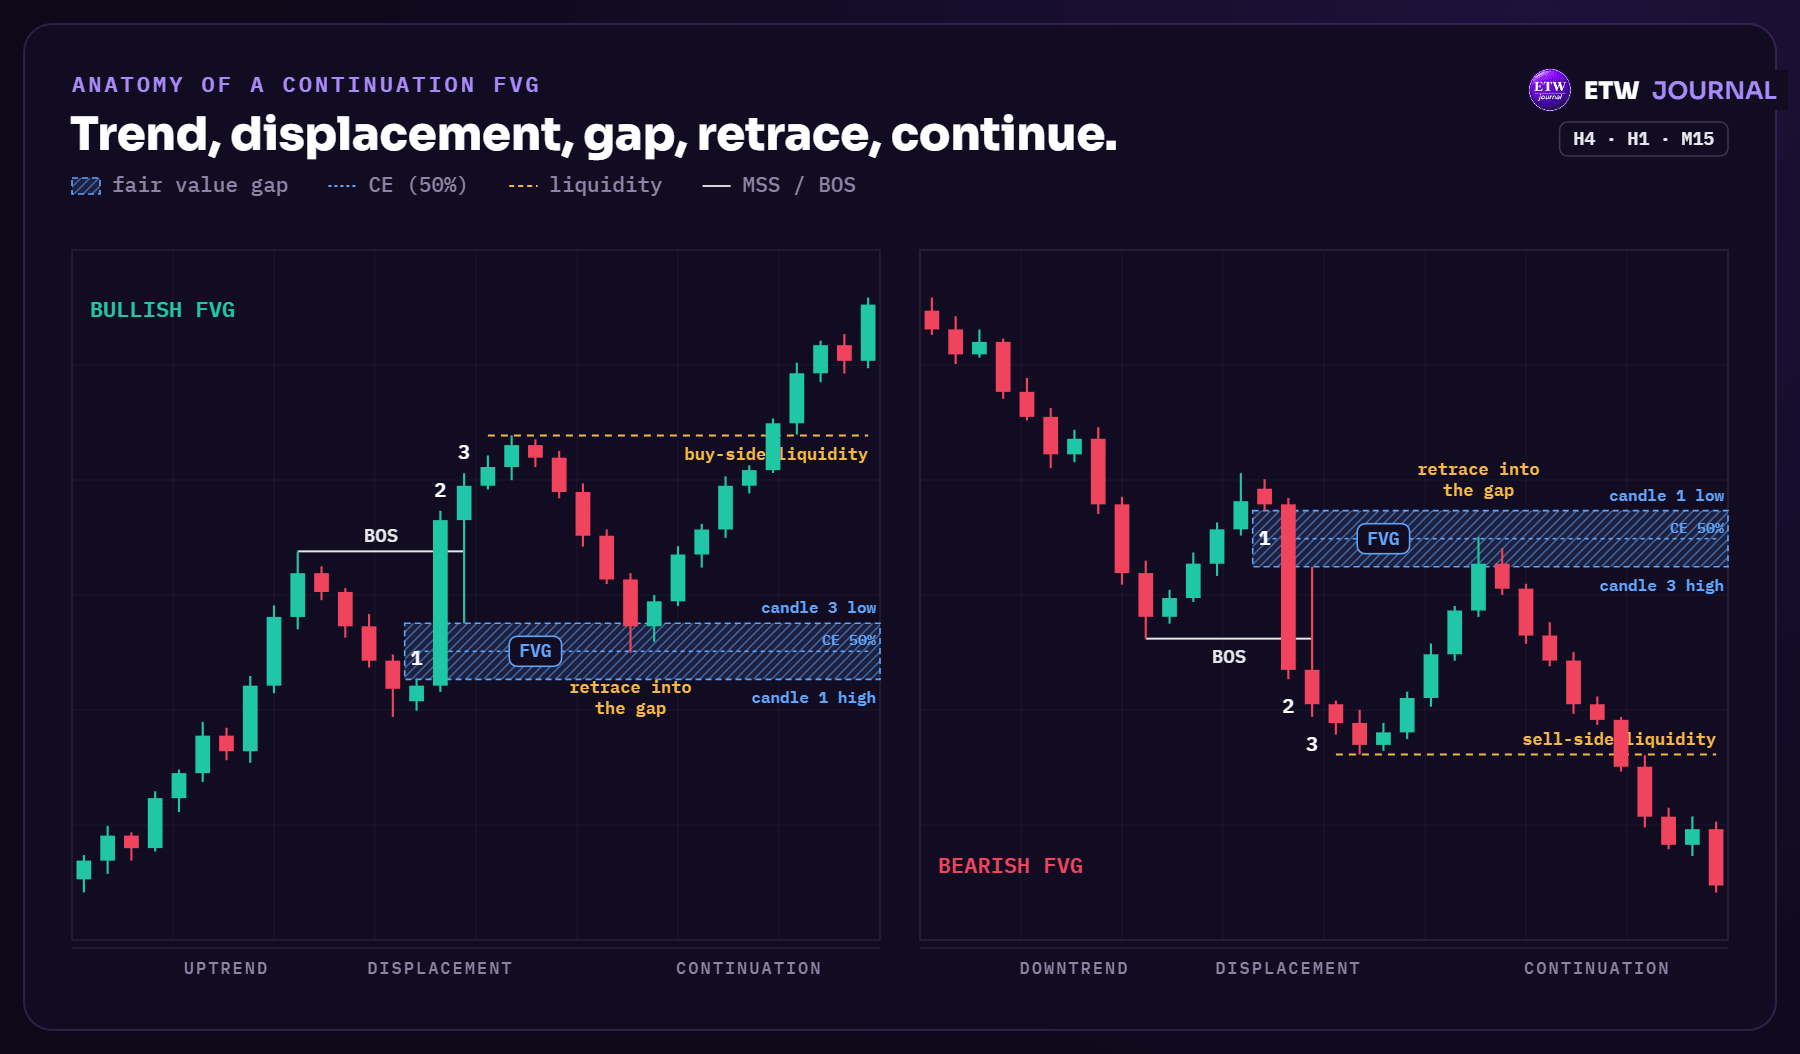
Two words in that definition do most of the work. Trend: we only trade gaps that point the same way as the higher-timeframe trend. Breaks structure: the candle that made the gap has to take out a swing point. A gap printed inside a choppy range is not this setup. If you need a refresher on gaps in general, read Fair Value Gaps (FVG) Explained first.
H4, H1 and M15: one job each
The model uses three timeframes, top down. Each one answers a single question, and you do not move to the next one until the current one says yes.
| Timeframe | Its job | What you mark |
|---|---|---|
| H4 | Direction and the zone | The trend, the last BOS, the FVG it left and the liquidity it is drawing to |
| H1 | Confirmation | The reaction inside the H4 FVG and an H1 shift back with the trend |
| M15 | The trigger | The M15 MSS, the M15 FVG it leaves, your entry, stop and target |
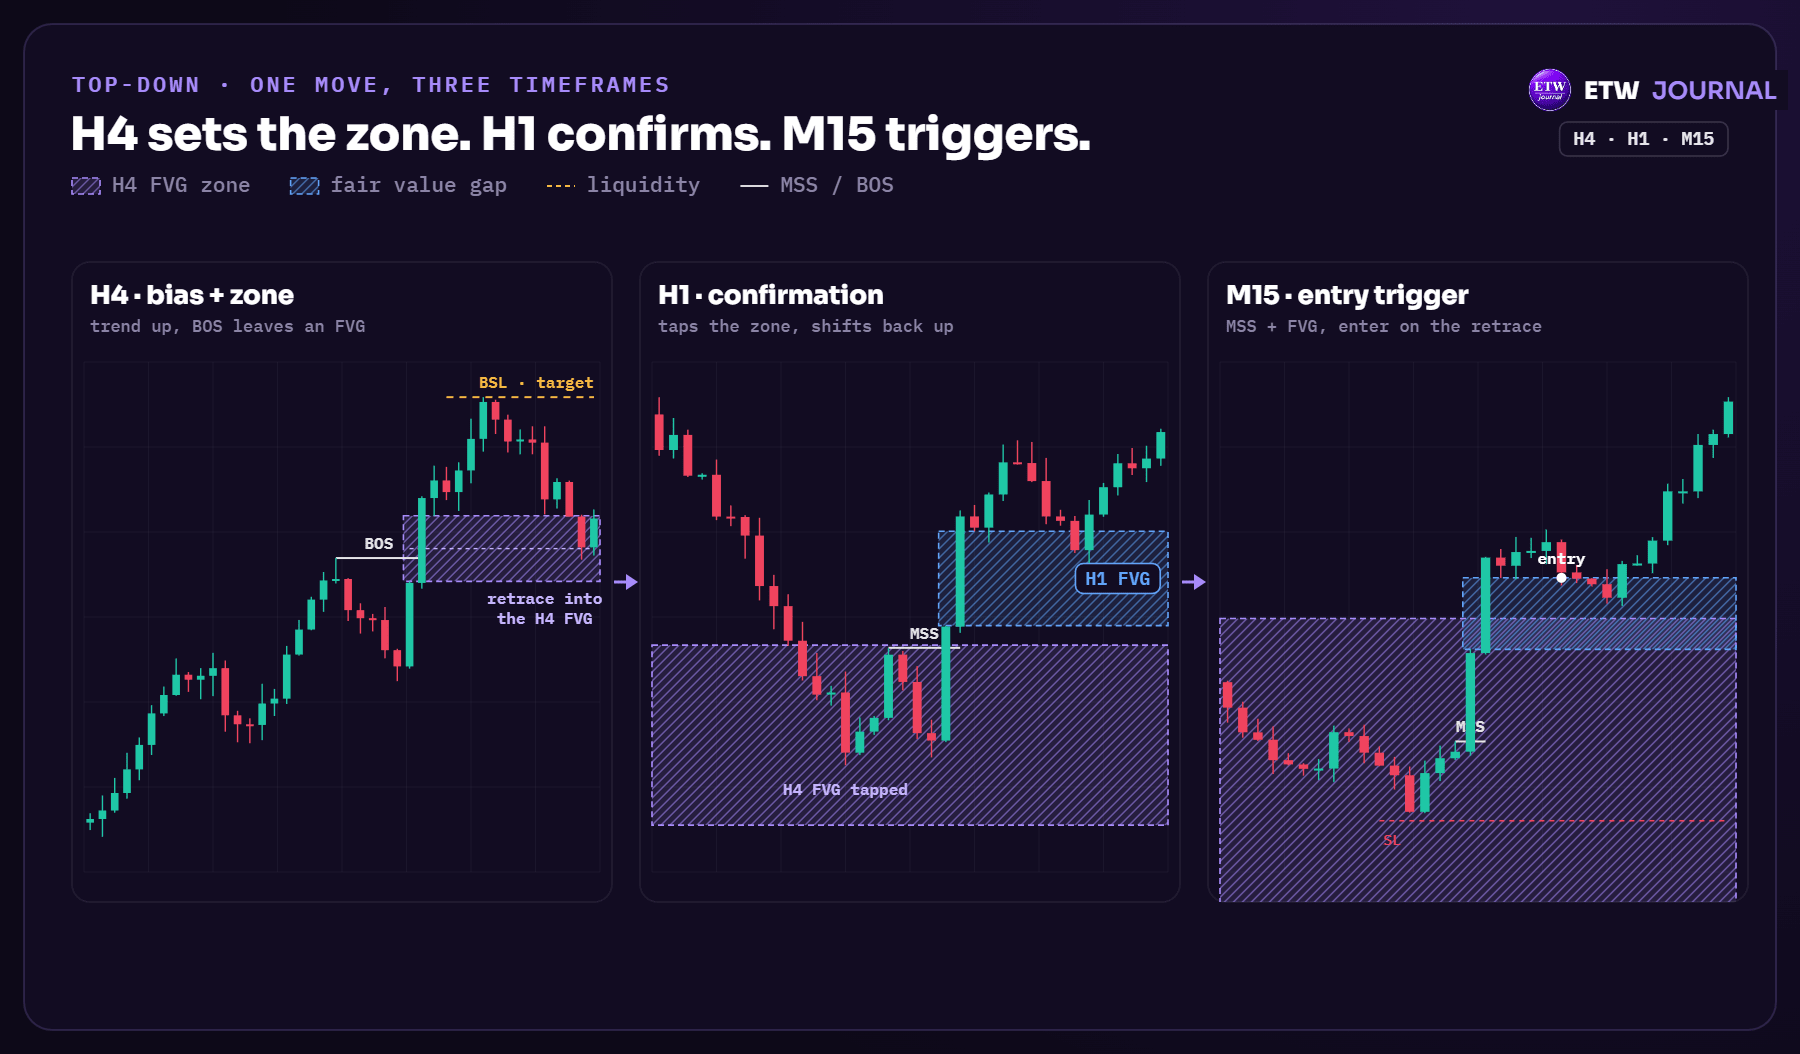
One rule keeps this clean: if the timeframes disagree, H4 wins. A bullish M15 FVG inside a bearish H4 trend is a counter-trend scalp, not this setup. Skip it.
Step 1: Read the H4 trend and the draw
Open the H4 and answer two questions.
- Which way is the trend? Higher highs and higher lows with a clean BOS to the upside means you only look for longs. Lower lows and lower highs with a BOS down means shorts only.
- Where is price going? In an uptrend, the draw is the buy-side liquidity above the latest H4 high. In a downtrend, it is the sell-side liquidity below the latest H4 low. That level becomes your final target.
If you can't answer both in ten seconds, the H4 is ranging. No trend, no continuation trade. Write the bias and the draw into Session Prep in ETW Journal before the session so you are not deciding it live.
Step 2: Mark the H4 FVG that broke structure
Find the displacement that made the last H4 BOS and mark the FVG it left behind, with its CE. That gap is your zone for the whole trade. Not every gap qualifies. A good H4 FVG has:
- Displacement: big-bodied candles with small wicks, not a slow grind.
- A BOS: the move that made the gap broke the last swing high (for longs) or low (for shorts).
- No fill yet: price has not already traded back through it. The first return is usually the best one.
- A good location: for longs, the gap sits in the lower half of the leg that broke structure. For shorts, in the upper half. Buying high in the leg or selling low in it shrinks your reward.
Step 3: Wait for the retrace into the H4 FVG
Do not chase the H4 displacement. Wait for price to come back into the gap. That can take hours or a couple of days, which is fine. Set an alert at the edge of the H4 FVG and walk away.
When the gap fails. Wicks into the gap are normal. A candle body closing through the far side of the H4 FVG is not. That means the gap failed, and it often flips into an inversion FVG that works against you. Cancel the idea and wait for a new structure.
Step 4: Confirm on the H1
Price reaching the H4 FVG is not a buy signal by itself. Drop to the H1 and wait for the zone to actually do something:
- Price taps the H4 FVG, ideally around its CE, and stops making new lows (for longs) or new highs (for shorts).
- The H1 then breaks the last lower high (longs) or higher low (shorts). That is the H1 market structure shift (MSS), and it tells you the pullback is likely over.
- Best case, that H1 move leaves its own H1 FVG. Now you have a gap inside a gap, both pointing with the trend.
No H1 reaction, no trade. Some days price slices straight through the H4 zone, and the H1 is what keeps you out of those.
Step 5: Trigger the entry on the M15
The M15 gives you the exact entry and a much tighter stop than the H1 would. Inside the H4 zone, look for the same pattern one level down: an M15 MSS in the trend direction, made by displacement that leaves an M15 FVG. That M15 FVG is where you enter.
Where to enter
You do not buy the M15 displacement candle. You wait for price to come back into the M15 FVG, and you can do it with a pending order so you don't have to watch.
- Near edge (first touch): buy limit at the top of a bullish M15 FVG (the low of candle 3), or sell limit at the bottom of a bearish one (the high of candle 3). You get filled more often, at a slightly worse price.
- CE (50% of the gap): a deeper limit at the middle of the M15 FVG. Better price and better reward to risk, but strong moves sometimes only tag the edge and leave without you.
Pick one and stick to it for at least 30 trades so your journal can tell you which works better for you.
Where the stop loss goes
Two sensible options. Both are fine, as long as you choose before you enter.
- Stop A, beyond the swing: a pip or two under the low that tapped the H4 FVG (longs), or above the high that tapped it (shorts). This is the structural stop. If price takes that level, the H1 shift has failed.
- Stop B, beyond the gap: just past the far edge of the M15 FVG, which is candle 1's high for a bullish gap and candle 1's low for a bearish one. Tighter and better reward to risk, but you will be stopped out more often. A more conservative version puts it past the whole of candle 1.
Rule of thumb: if the M15 FVG is small compared to the move you expect, Stop A is usually still a great trade. If Stop A makes the risk too big for your account, use Stop B with smaller size, or skip it.
Where to take profit
The target is liquidity in the direction of the trend:
- Partials: the nearest H1 high (longs) or H1 low (shorts) that price has to get through on the way.
- Final target: the H4 swing high (buy-side liquidity) for longs, or the H4 swing low (sell-side liquidity) for shorts. This is the draw you marked in Step 1.
Taking something off at the H1 level and moving the rest to break-even is a good habit, especially while you are still collecting data on the model.
Long projection: EURUSD, H4 to M15
Here is the whole model on a long. The H4 is in an uptrend. A strong move breaks the last H4 high and leaves an H4 FVG between 1.15935 and 1.16244, with its CE at 1.16090. Price runs to a new H4 high at 1.16802, then pulls back.
During Asia the pullback reaches the H4 FVG and taps 1.16038, just below the CE, without a body closing through the gap. At the London open the H1 and M15 shift back up: price breaks the last M15 lower high for the MSS and leaves an M15 FVG between 1.16101 and 1.16163. The first retrace into that gap is the entry.
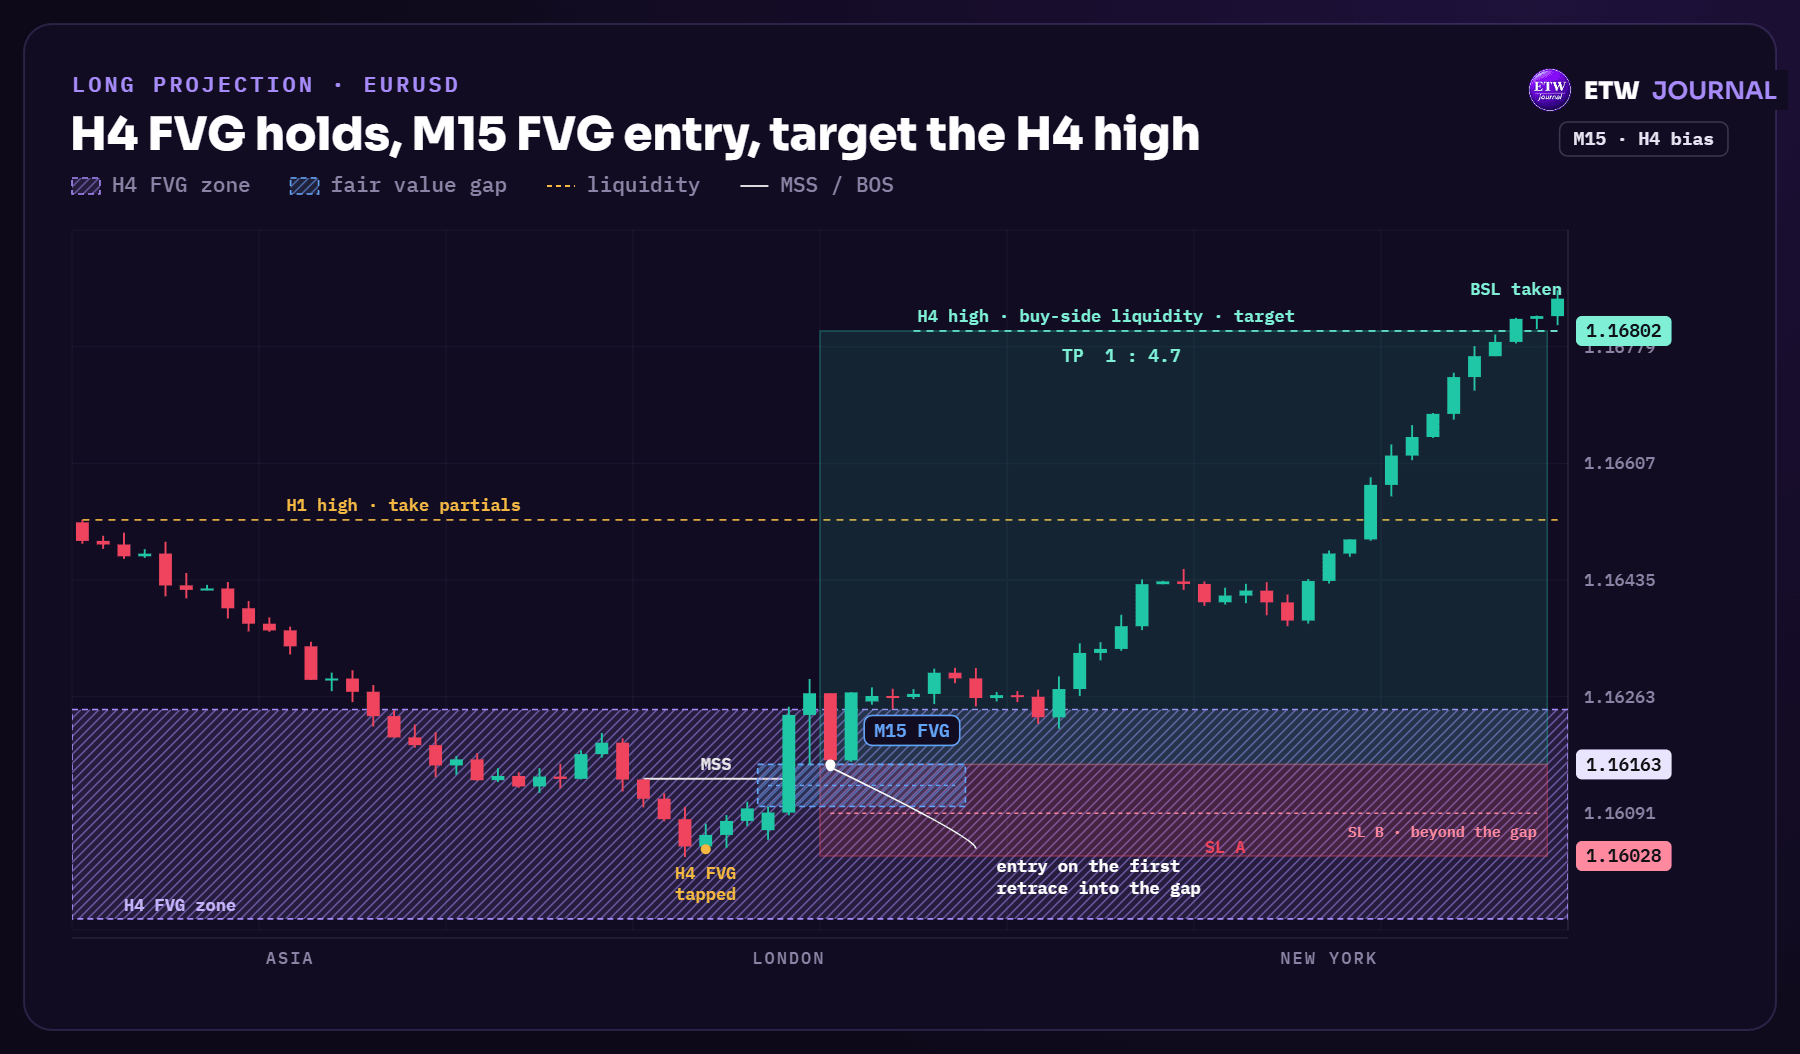
- Entry: 1.16163, the top of the M15 FVG (buy limit)
- Stop A: 1.16028, under the low that tapped the H4 FVG (13.5 pips)
- Stop B: 1.16091, a pip under the gap (7.2 pips)
- Partials: H1 high at 1.16524 (36.1 pips, about 2.7R with Stop A)
- Final target: H4 high at 1.16802 (63.9 pips). That is about 1 : 4.7 with Stop A and close to 1 : 8.9 with Stop B.
Notice the trade did not fly straight to target. It moved sideways for a while after entry and only expanded in New York. That is normal, and it is exactly why a fixed plan beats watching every candle.
Short projection: XAUUSD, H4 to M15
Now the mirror on gold. The H4 is in a downtrend. A sharp sell-off breaks the last H4 low and leaves a bearish H4 FVG between 4,004.68 and 4,013.94. Price retraces up into it and stalls just under 4,011.
In the New York morning the H1 and M15 turn back down. The M15 breaks its last higher low and leaves a bearish M15 FVG between 4,007.11 and 4,008.97. The first rally back into it is the sell.
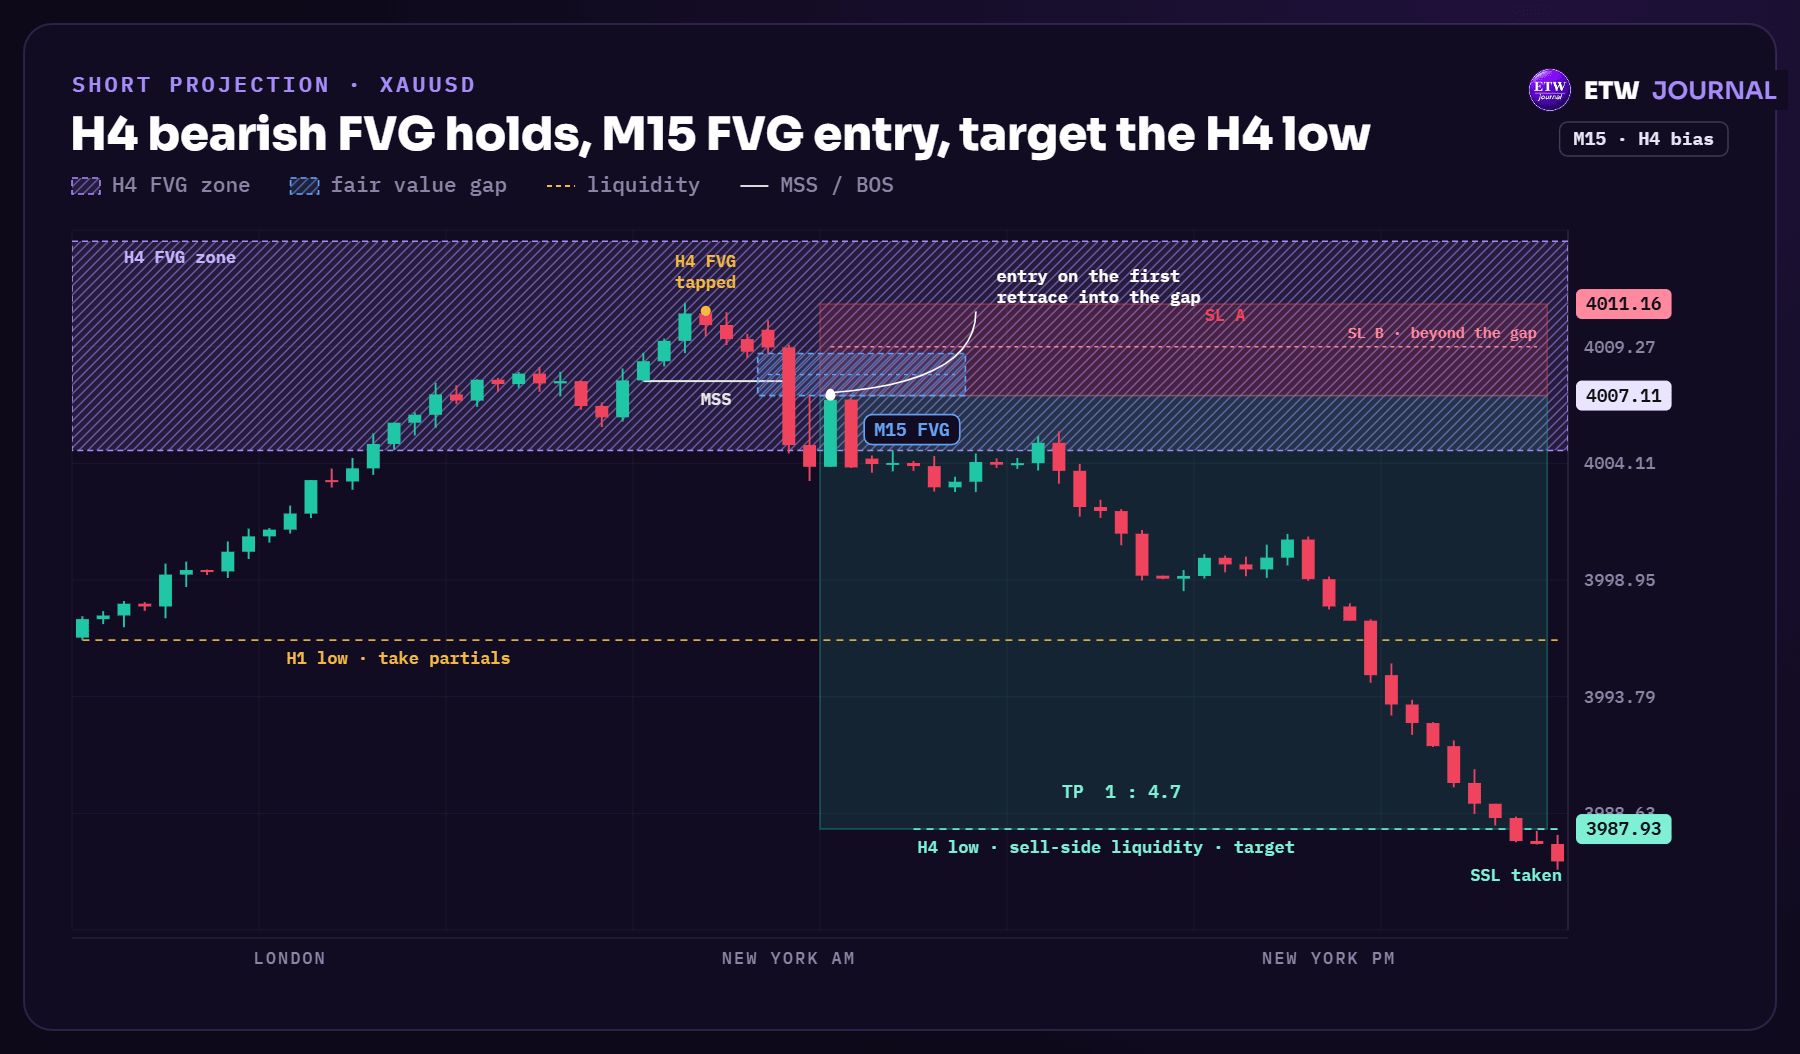
- Entry: 4,007.11, the bottom of the M15 FVG (sell limit)
- Stop A: 4,011.16, above the high that tapped the H4 FVG ($4.05)
- Stop B: 4,009.27, just above the gap ($2.16)
- Partials: H1 low at 3,996.29 ($10.82)
- Final target: H4 low at 3,987.93 ($19.18), about 1 : 4.7 with Stop A
Same rules, any market. The levels change from pair to pair, but the sequence never does: H4 trend and FVG, retrace, H1 shift, M15 FVG, target the liquidity. If you trade indices or crypto, use the exact same steps.
Mistakes that kill this setup
- Trading against the H4. A perfect M15 FVG pointing against the H4 trend is the most common way to lose with this model.
- Trading gaps with no BOS. If the displacement didn't break a swing, it is just a fast candle in a range.
- Entering as soon as price touches the H4 zone. Wait for the H1 shift. The zone is where you look, not where you click.
- Ignoring a body close through the gap. Once a candle closes through the far side, the FVG has failed. Don't hope it comes back.
- Trading the third or fourth touch. The first return into a gap is the cleanest. Every extra touch eats the orders that were sitting there.
- Random targets. 1 : 3 is not a target. The H1 high and the H4 high (or lows) are the targets.
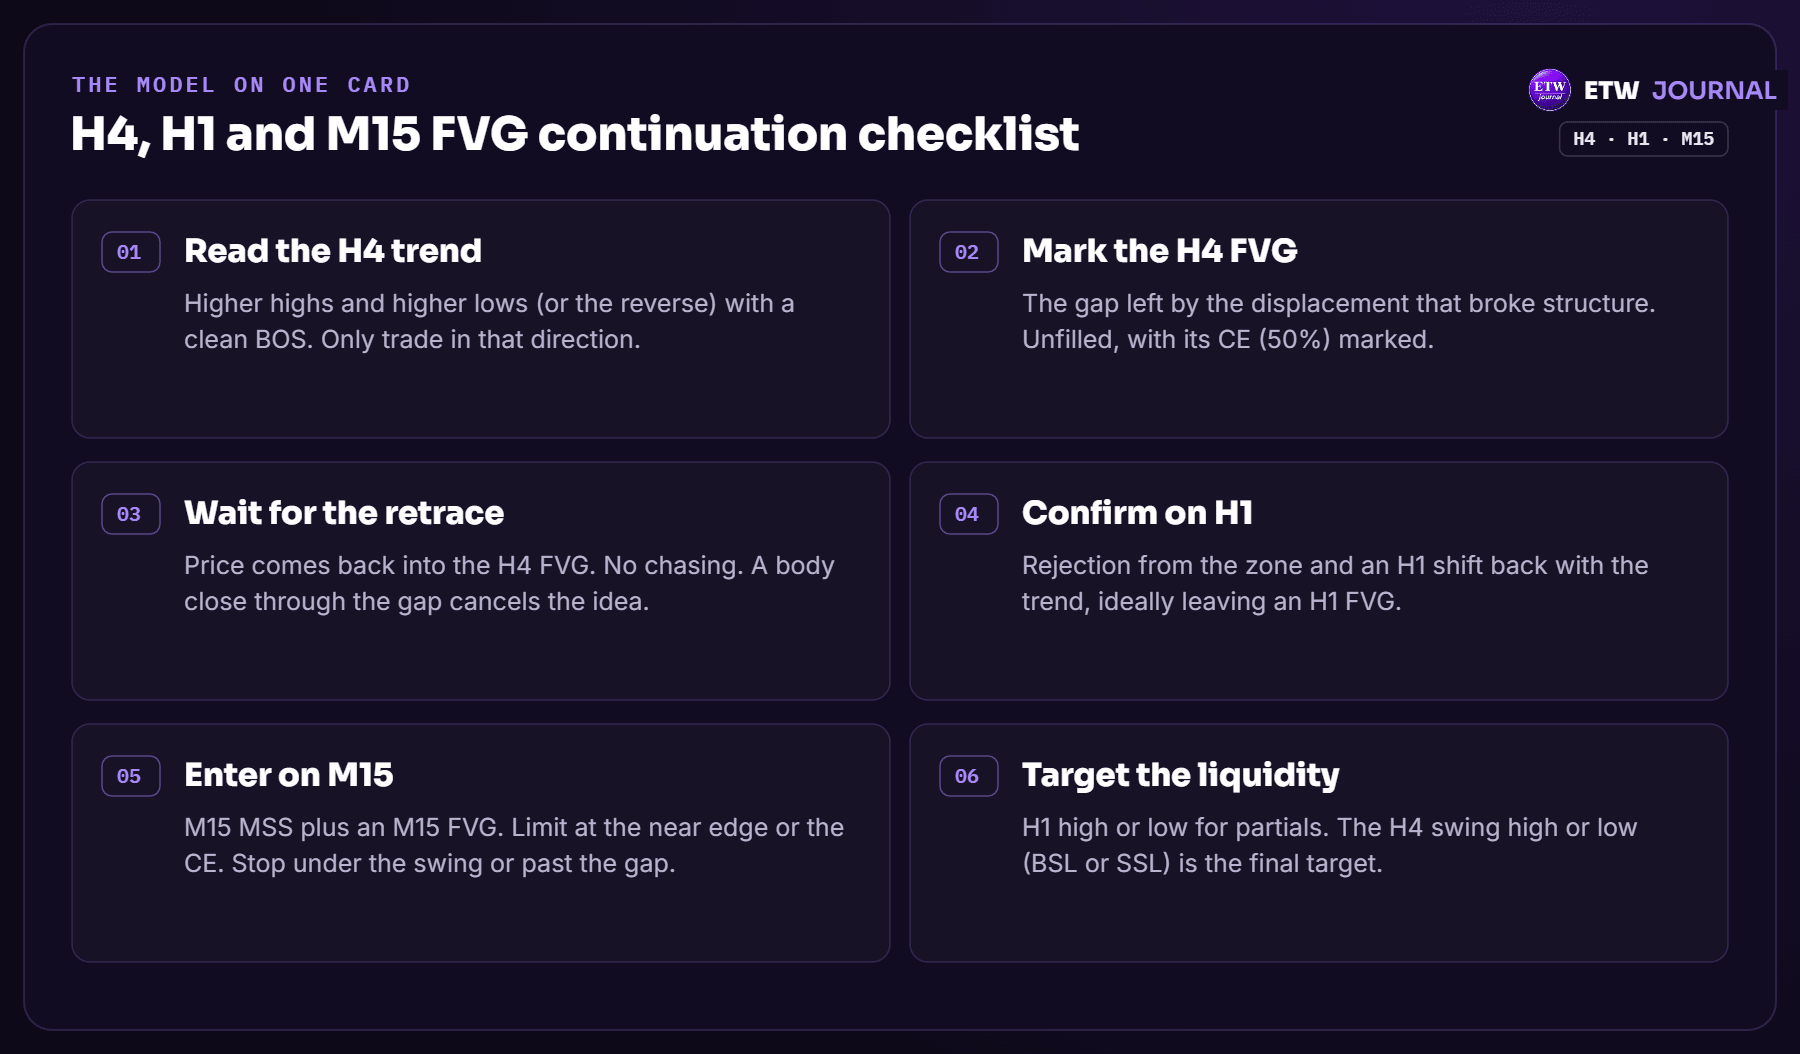
The whole model on one card
Journal it so you know if it works
A model is only as good as your record of it. Every time you take this setup, tag it in ETW Journal with the timeframe of your entry gap, like H4 FVG, H1 FVG or M15 FVG, plus whether you used Stop A or Stop B and whether you entered at the edge or the CE. Our guide on how to use tags in ETW Journal shows you how.
After 30 to 50 trades, open your tag reports and Tag Lab and look for the answers. Do edge entries or CE entries make you more money? Does Stop B get hit too often? Are London setups better than New York ones? Your own numbers will answer that better than any blog post can.
Before you risk real money, collect the data. Open ETW Journal, go to Backtesting and replay H4, H1 and M15 charts bar by bar. Here's how backtesting works in ETW Journal.
Trading carries real risk of loss. The charts in this post are educational examples, not signals or financial advice. Always test a model and size your risk before trading it live.
Keep it simple. H4 trend, H4 gap, wait, H1 shift, M15 gap, target the liquidity. Do that well for a few months and let your journal tell you the rest.