 ETW

Fair value gaps are one of the most talked-about ideas in ICT and smart money trading, and for good reason. They show you exactly where price moved so quickly that one side of the market barely got a chance to trade. Those areas act like magnets: price often comes back to them, and when it does, they can give you precise, low-risk entries. This guide explains what fair value gaps and liquidity voids are, the different types of FVG, how deep price usually fills them, and a step-by-step way to trade them.
What is a fair value gap (FVG)?
A fair value gap is a price area that the market moved through in one direction with very little two-sided trading. On a chart it shows up as a three-candle pattern: a large middle candle whose body leaves a gap between the wick of the candle before it and the wick of the candle after it. That gap is the FVG.
- A bullish FVG forms during a strong move up. It marks a buy-side imbalance (sell-side inefficiency) where buyers overwhelmed sellers.
- A bearish FVG forms during a strong move down. It marks a sell-side imbalance (buy-side inefficiency) where sellers overwhelmed buyers.
Because the market skipped over that area, it is "unfinished business". Price often returns to rebalance the gap before continuing, and FVGs become even more powerful when they line up with an order block.
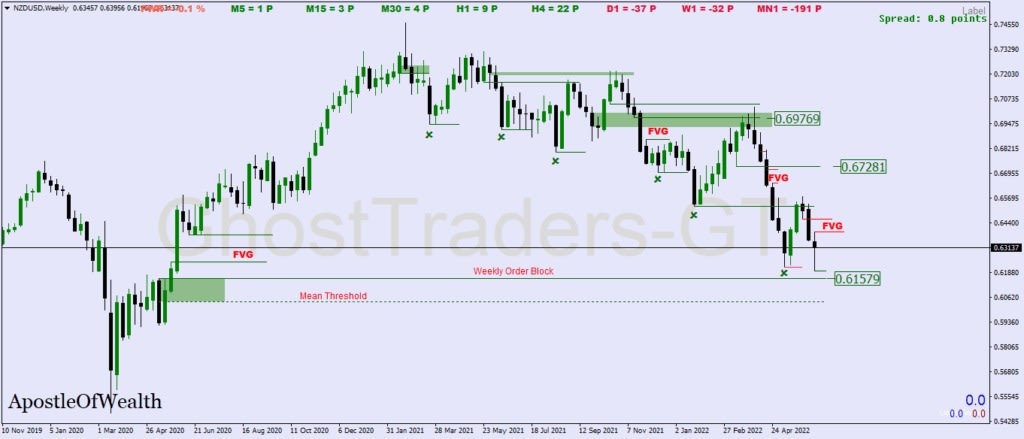
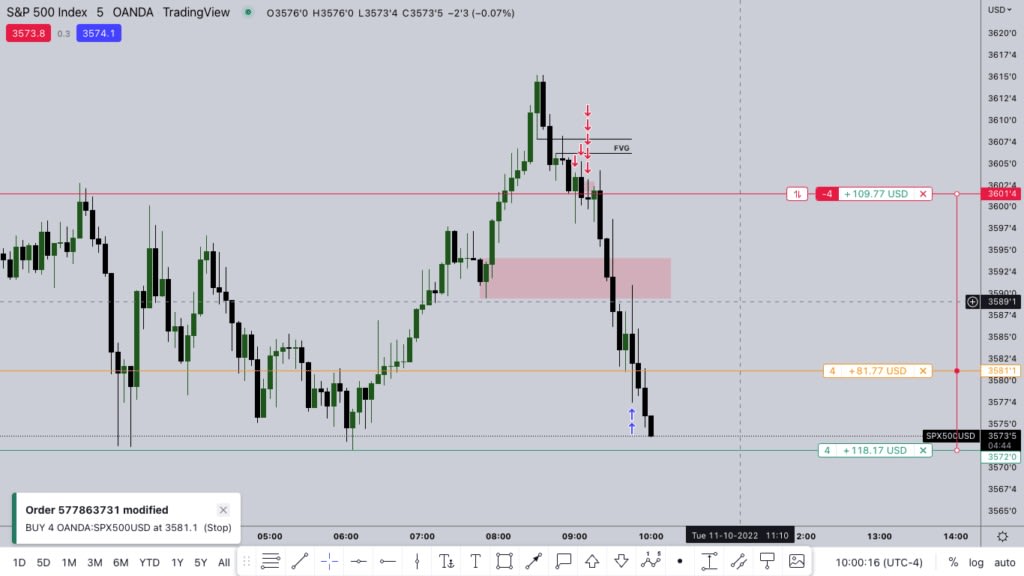
In the example above, price came back into a bearish FVG, respected it, and then dropped sharply. Reading the overall order flow (whether the market is delivering higher or lower) helps you pick which gaps are most likely to hold.
Types of fair value gaps
In a strong move you will often see a sequence of FVGs. Each one tells you something different.
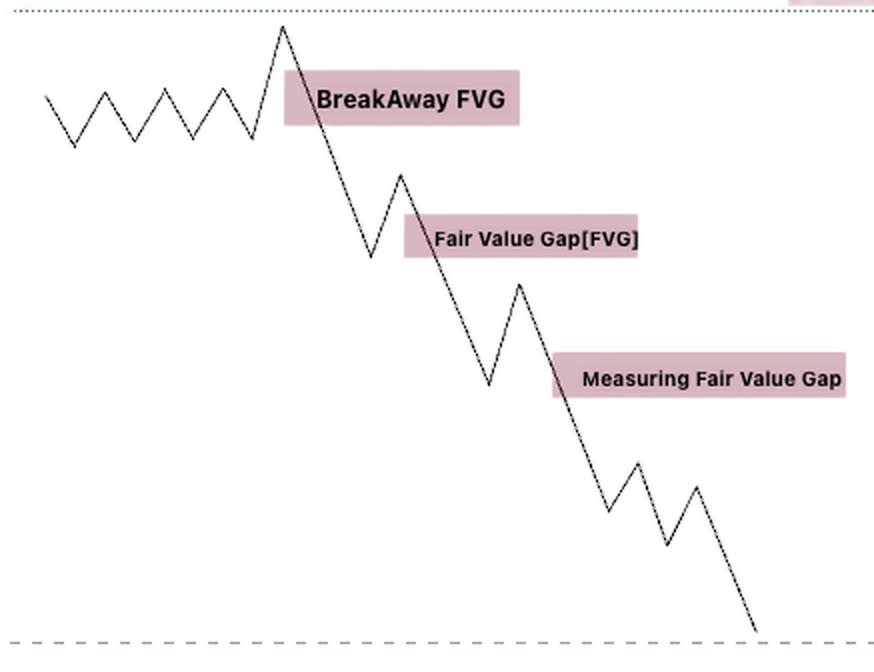
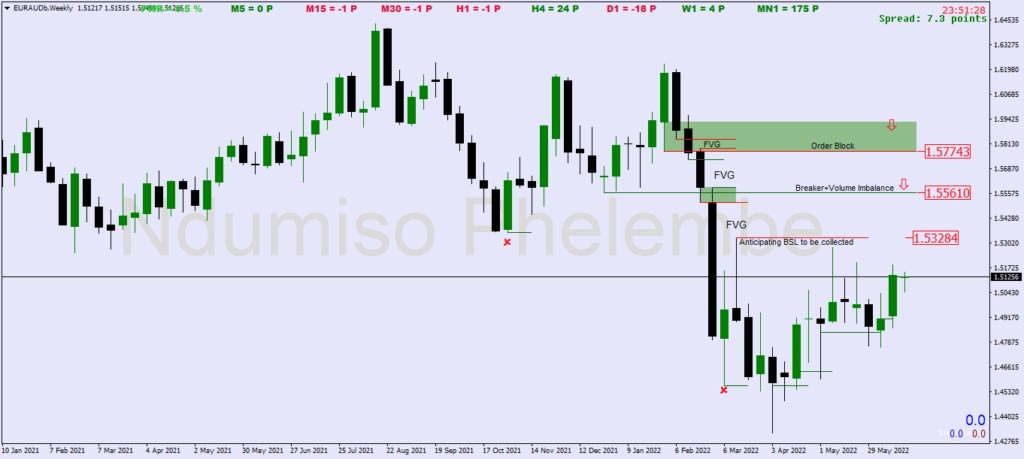
Breakaway FVG
A breakaway gap forms when price breaks out of a consolidation or trading range. In a bullish breakaway gap, price breaks above resistance and buyers take control. In a bearish breakaway gap, price breaks below support and sellers take control.
Breakaway gaps often stay open. They reflect a sudden shift in sentiment, so there is little interest in trading back at that level: traders trapped on the wrong side want out, and new traders see it as too risky to enter there. The gap can stay open until a large wave of buying or selling eventually returns to it.
Measuring FVG
A measuring gap forms later in the move, after the first FVG. It also tends to stay open because heavy institutional order flow is pushing price decisively in one direction, leaving little room for a retracement. A bearish measuring gap confirms bearish order flow; a bullish one confirms bullish order flow. Think of it as a sign that the big players are still in control.
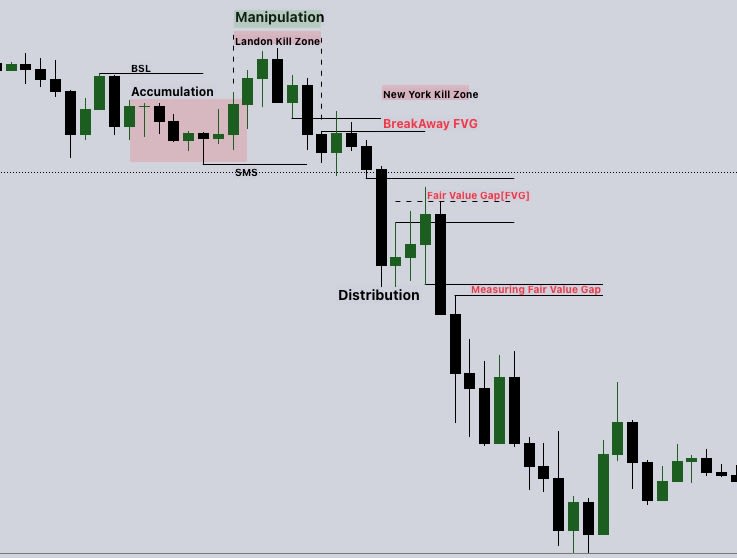
The chart above puts it all together: accumulation, a manipulation move to take buy-side liquidity around the London session, then distribution lower with a breakaway FVG, a regular FVG and a measuring FVG forming one after the other.
Fair value gaps and order blocks
An order block is the last up-close or last down-close candle before a strong move that changes the direction of price delivery. A fair value gap right after that candle is what validates it: it proves the move away was strong and one-sided. When an order block and an FVG sit together, you have a higher-probability zone to trade from.
What is a liquidity void?
A liquidity void is a bigger version of the same idea. It forms when price moves sharply in one direction with large, long-range candles and very little trading along the way. Price tends to come back later to fill the void.
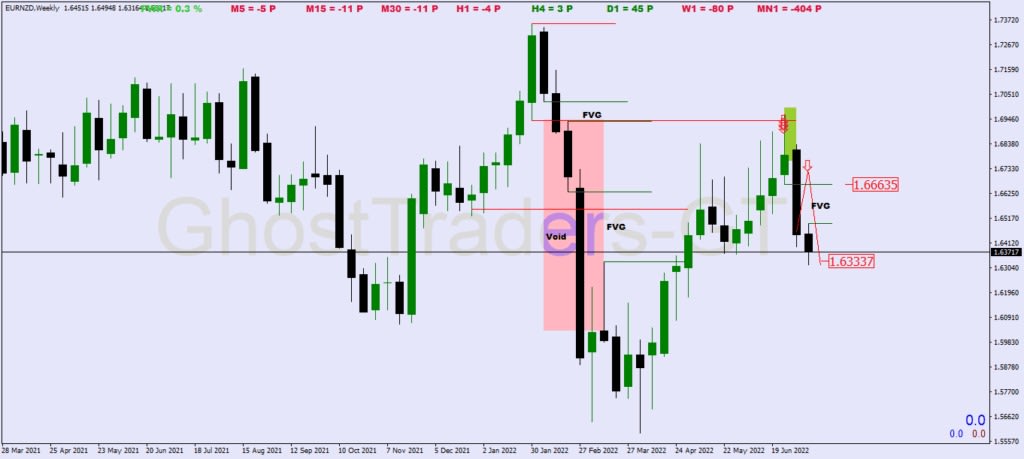
FVG vs liquidity void: both show a buy-side or sell-side imbalance. The difference is how they look on the chart. A fair value gap is a specific gap between candle wicks, while a liquidity void is a whole run of long-range candles with little overlap.
How deep does price fill an FVG?
Price does not always fill a fair value gap completely. Strong order flow can push it away again before it gets to the other side. Two concepts help you avoid missing trades.
Consequent encroachment (the 50% level)
Consequent encroachment is when price fills a fair value gap to its 50% level, also called the mean threshold of the FVG. Since price may never reach the far edge of the gap, the midpoint is often a better place to aim your entry than the full fill.
Institutional order flow entry drill (IOFED)
An IOFED happens when price only fills less than 50% of the gap before reversing. It is a sign of very strong order flow. In the chart below, price only tapped the top part of the FVG and then dropped hard.
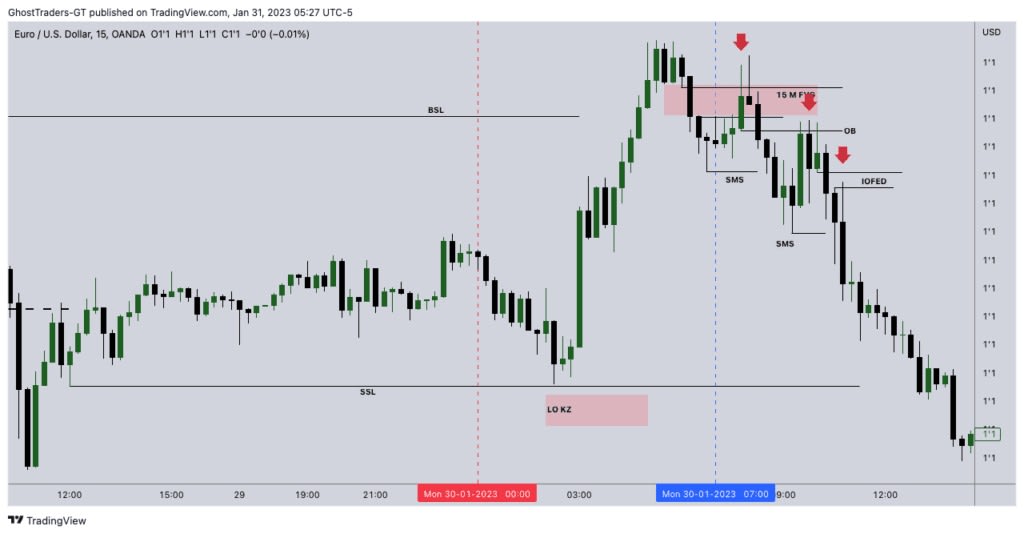
Entry tip: if you always wait for a full fill, you will miss many of the strongest moves. Plan entries at the edge of the gap (IOFED) or at the 50% mean threshold (consequent encroachment), and place your stop beyond the far side of the gap.
How to trade fair value gaps: a reversal model
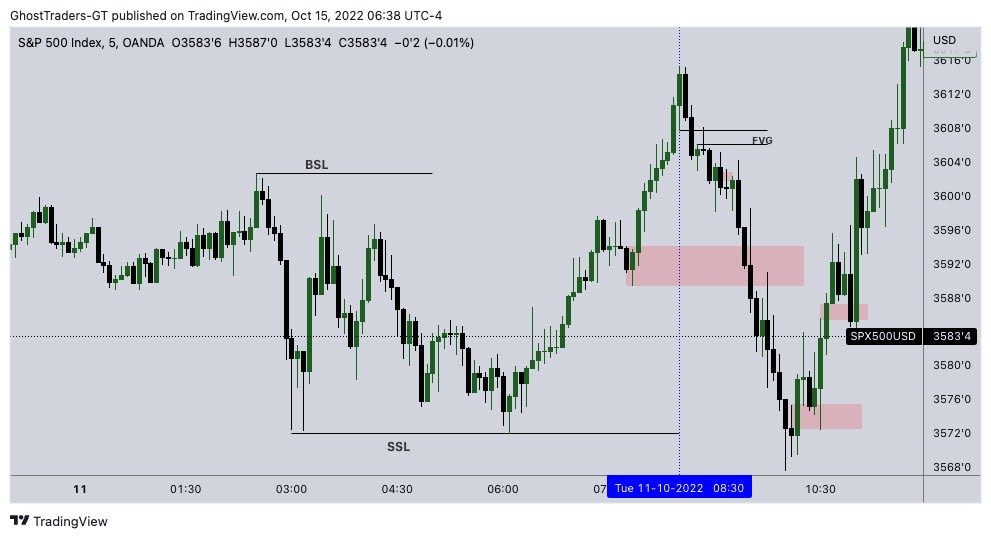
Once price takes buy-side or sell-side liquidity, it can reverse, retrace or continue. This model focuses on reversals, using the FVG as the entry point. It uses four reference points: buy-side liquidity (BSL), sell-side liquidity (SSL), a shift in market structure (SMS) and the fair value gap.
Sell setup
- Wait for price to take buy-side liquidity. Price runs above an obvious high where buy stops are resting.
- Wait for a shift in market structure. Price breaks below the most recent swing low, confirming sellers have stepped in.
- Find the bearish FVG created by that move down.
- Enter short when price retraces into the FVG (at the edge or the 50% level), with your stop above the swing high.
- Target the sell-side liquidity below, such as the previous lows.
Buy setup
- Wait for price to take sell-side liquidity. Price runs below an obvious low where sell stops are resting.
- Wait for a shift in market structure. Price breaks above the most recent swing high.
- Find the bullish FVG created by that move up.
- Enter long when price retraces into the FVG, with your stop below the swing low.
- Target the buy-side liquidity above, such as the previous highs.
Common FVG mistakes: trading every gap on the chart, ignoring higher-timeframe order flow, entering before a shift in market structure, and expecting a full fill every time. Not every gap holds, so always use a stop.
Track your FVG trades in ETW Journal
FVG trading has a lot of moving parts, so measuring what works is essential. In ETW Journal, tag each trade with the type of gap (breakaway, measuring, FVG with order block), whether you entered at the edge or the 50% level, and which liquidity was taken first. Attach a screenshot with the gap marked. Over time your analytics will show which combinations give you the best win rate and R multiple, and you can practise the model bar by bar in the backtesting workspace before trading it live.
Charts in this guide are from the GhostTraders guide on fair value gaps and liquidity voids.