 ETW

Last updated: October 14, 2026
Most intraday traders have the same problem. They know where price is, but not where the market thinks fair value is. VWAP fixes that. It's one line on your chart that shows the average price the market has actually traded at today, weighted by volume. When price is above it, buyers are in control. When price is below it, sellers are.
This guide walks through a complete VWAP trading strategy: the two VWAP levels it uses, the exact buy and sell entry rules, where to put your stop loss and target, the "VWAP kiss" pullback entry, and seven annotated charts showing real trades, including one that lost.
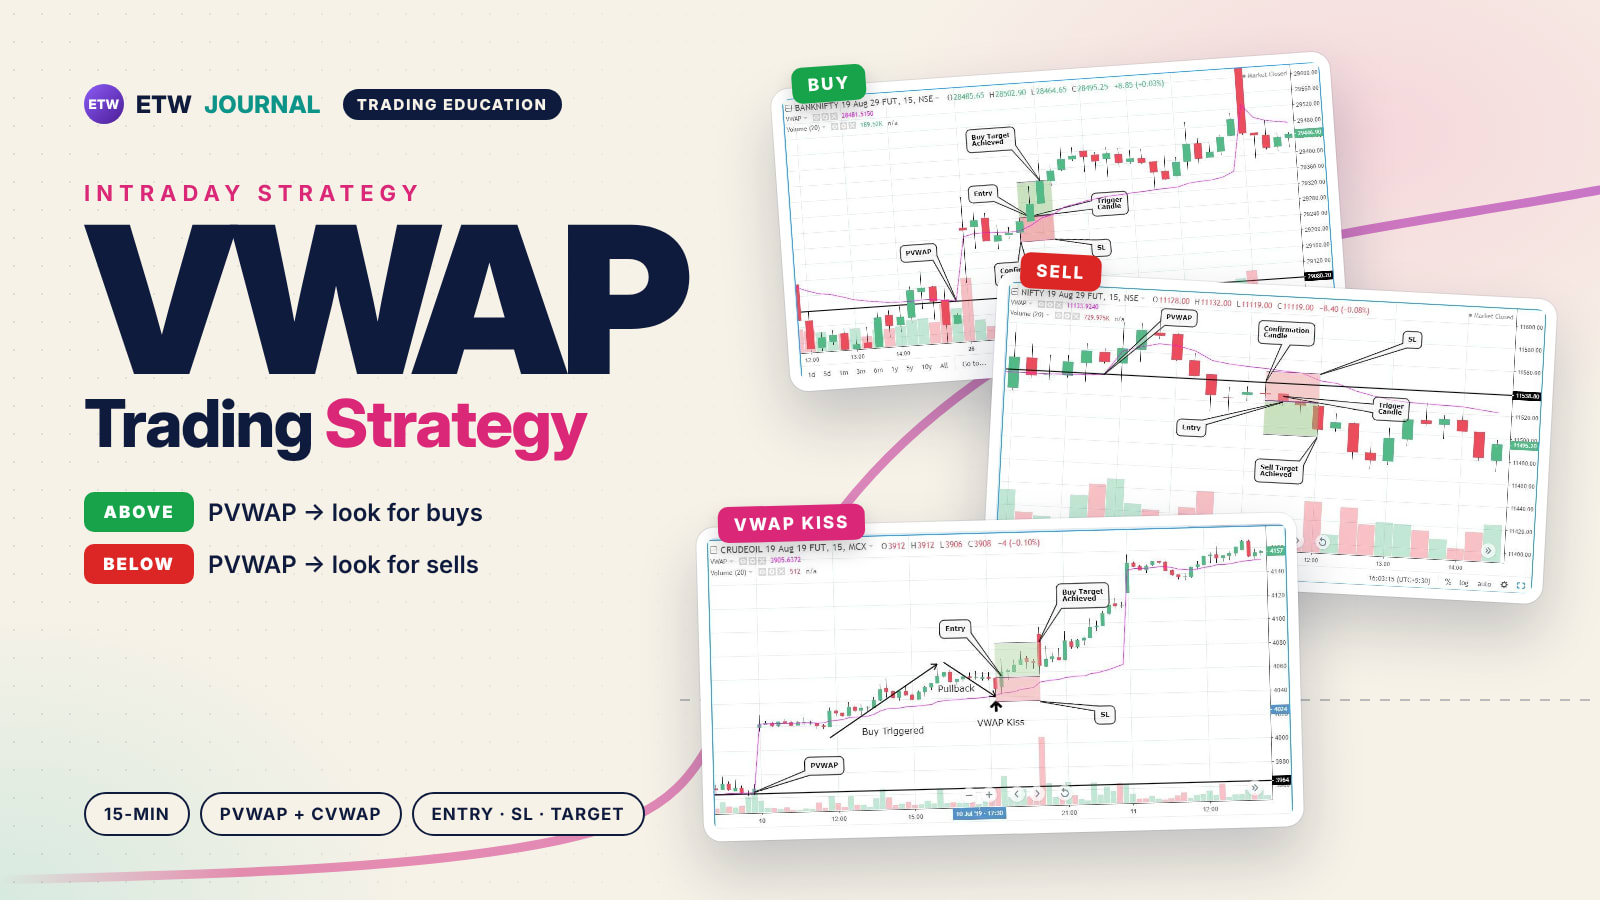
The strategy in one line: trade only in the direction of yesterday's closing VWAP. Above it, wait for a 15-minute candle to close above both VWAP levels and buy the break of its high. Below it, wait for a close below both and sell the break of its low.
Strategy at a Glance
| Setting | Value |
|---|---|
| Type | Intraday (open and close the trade the same day) |
| Indicator | VWAP only (volume weighted average price) |
| Timeframe | 15 minutes |
| Markets | All instruments: indices, stocks, commodities and currencies |
| Risk to reward | Roughly 1:1 |
What Is VWAP?
VWAP stands for volume weighted average price. It adds up the price of every trade during the session, weights each one by how much volume traded there, and divides by the total volume. The result is a line that follows price but gives more weight to the levels where the most business was done. It resets at the start of every session.
Because VWAP already combines price, volume and time, this strategy doesn't use any other indicator. You'll find VWAP on every major charting platform. Open the Indicators (or Studies) menu, search for "VWAP" and add it to a 15-minute chart.
The Two Levels: PVWAP and CVWAP
The strategy uses VWAP in two ways:
- PVWAP (previous VWAP): where VWAP finished at the close of the previous session. Find the last candle of yesterday's session, note the VWAP value, and draw a horizontal line there. In the charts below that's the black horizontal line. PVWAP tells you the bias for the day.
- CVWAP (current VWAP): today's live VWAP line. It moves as price and volume change through the session. CVWAP is the line your entry candle has to cross.
The Core Idea: Trade With the PVWAP Bias
- If price is trading above PVWAP, the market is bullish and you only look for buys.
- If price is trading below PVWAP, the market is bearish and you only look for sells.
That one filter keeps you out of most counter-trend trades. You're not guessing where the reversal is. You're trading with the side that has controlled the market since yesterday.
Entry Rules
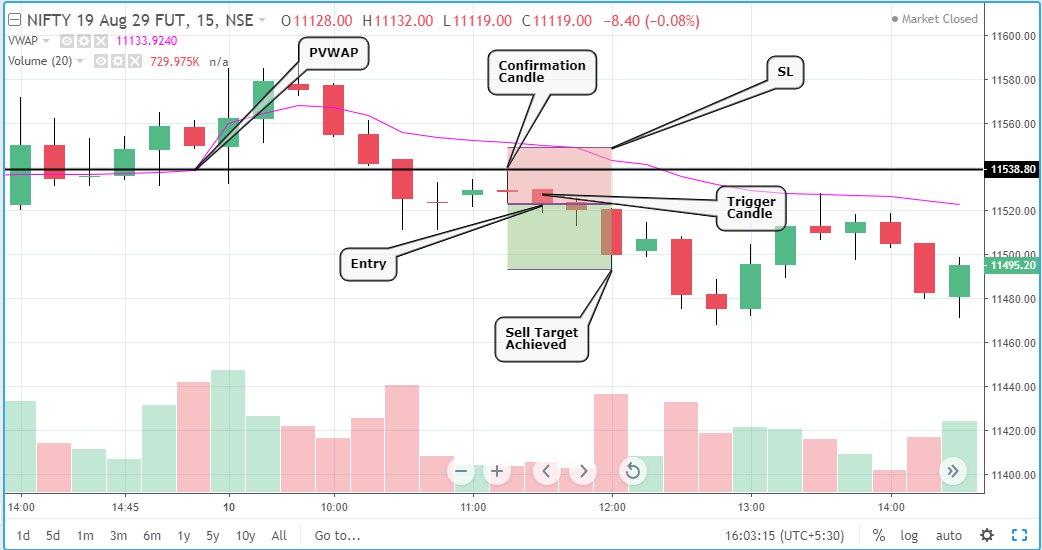
Every trade uses two candles: a confirmation candle and a trigger (entry) candle.
Buy entry
- Price is above PVWAP.
- Find the latest 15-minute candle that crosses CVWAP and closes above both CVWAP and PVWAP. This is the confirmation candle.
- Place a buy entry just above the high of the confirmation candle.
- The candle that breaks that high and fills your order is the trigger candle.
Sell entry
- Price is below PVWAP.
- Find the latest 15-minute candle that crosses CVWAP and closes below both PVWAP and CVWAP. This is your confirmation candle.
- Place a sell entry just below the low of the confirmation candle.
- The candle that breaks that low triggers the trade.
If price never breaks the confirmation candle's high (for a buy) or low (for a sell), there's no trade. Waiting for the break is what stops you from buying a close that immediately reverses.
Stop Loss and Target
The original strategy uses fixed point targets and stops for the Indian index and crude oil futures it was built on (NF is Nifty futures, BNF is Bank Nifty futures), and a percentage rule for everything else:
| Instrument | Target | Stop loss |
|---|---|---|
| Nifty futures (NF) | 30 to 35 points | 25 points |
| Bank Nifty futures (BNF) | 90 to 120 points | 60 points |
| Crude oil | 30 to 50 points | 20 points |
| Everything else | 1% to 1.2% from entry | 1% from entry |
If you trade gold, NAS100, forex or stocks, use the "everything else" row as your starting point, then backtest to find the point values that suit your market's normal 15-minute range. The goal is the same either way: a target that's at least as big as your stop, so the strategy pays you around 1:1 or better.
How much to risk
Risk 1% to 2% of your account per trade, and size your position from the stop distance. For example, with a $10,000 account and 1% risk, your maximum loss is $100. If your stop is 25 points away, your position size should lose no more than $100 over those 25 points. Never size up because a setup "looks perfect".
The Strategy on Real Charts
The charts below are 15-minute futures charts. The pink line is CVWAP and the black horizontal line is PVWAP. Green boxes show the target zone and red boxes show the stop loss.
Chart 1: Bank Nifty buy, target hit
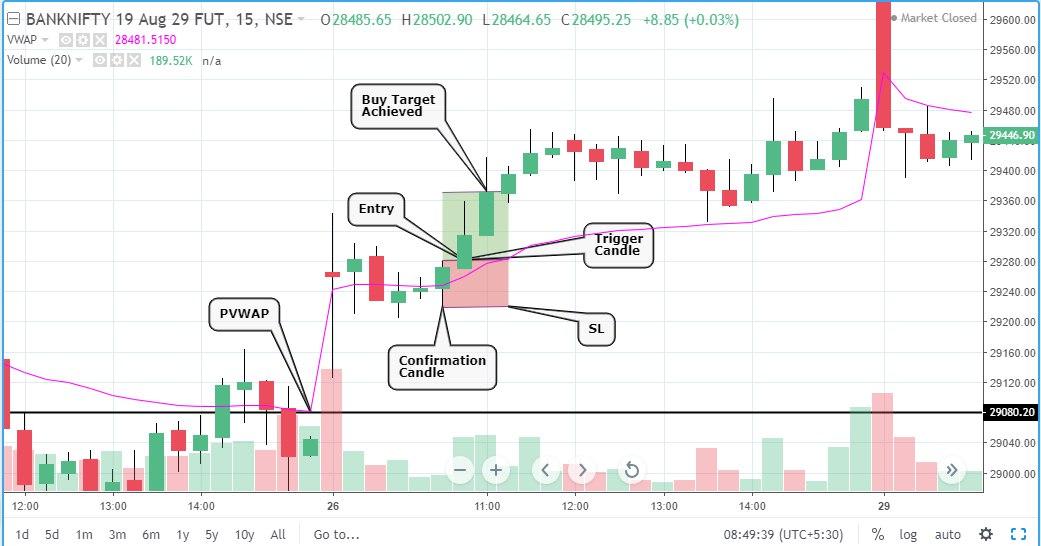
Chart 2: Tata Motors buy, target hit
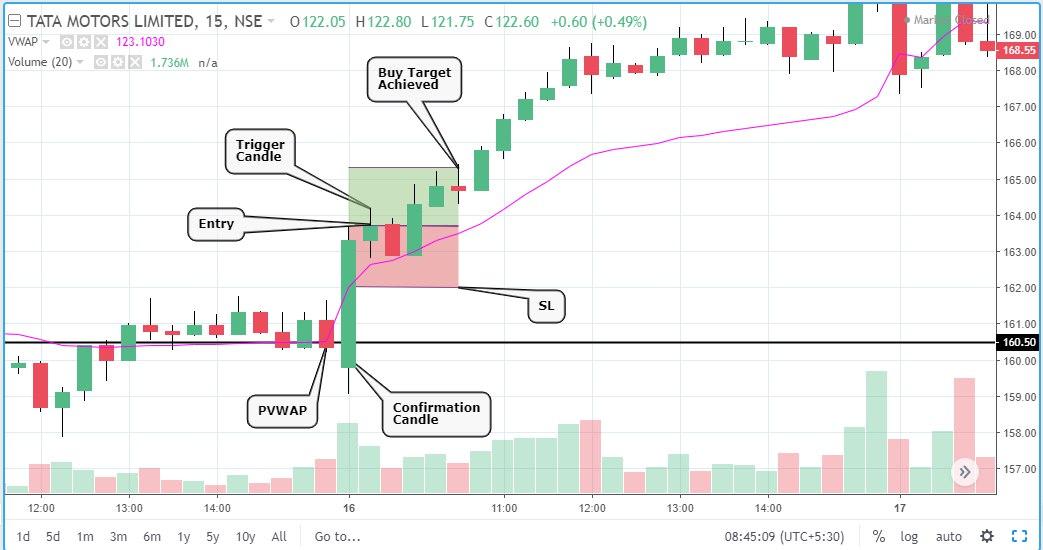
Chart 3: Nifty sell, stop loss hit
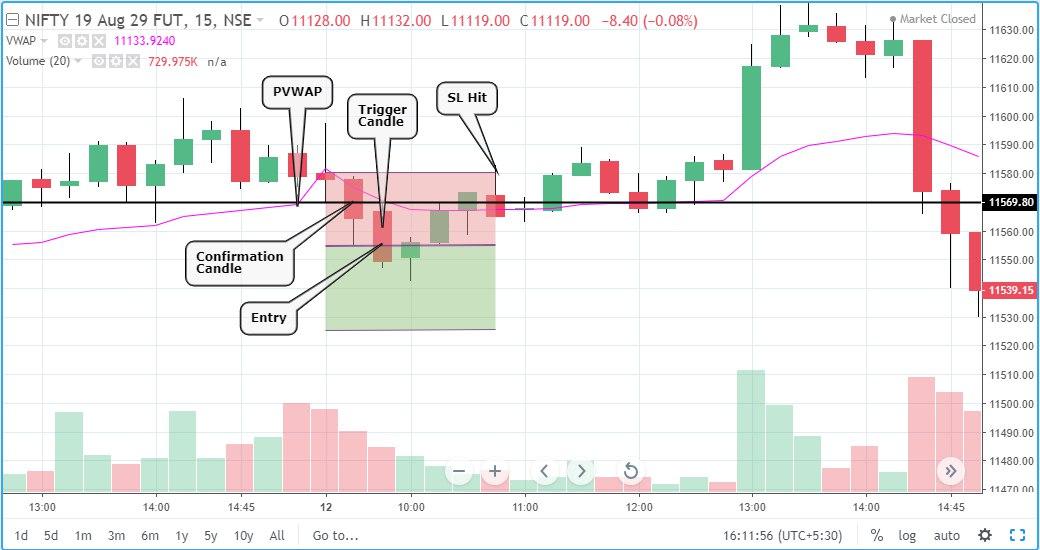
Chart 4: Nifty sell, target hit
The VWAP Kiss: A Safer Pullback Entry
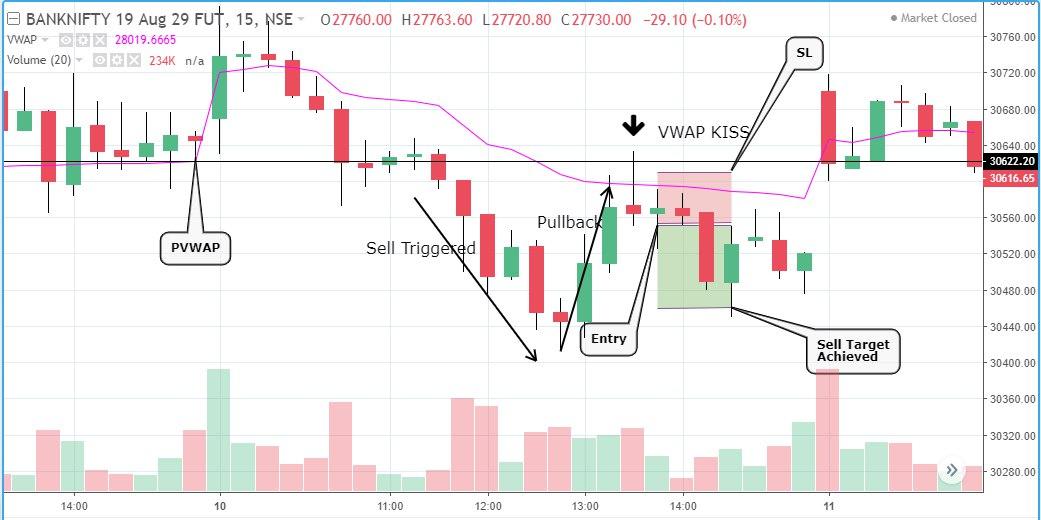
The first VWAP breakout of the day is the one most likely to be fake. If that worries you, skip it and wait for a VWAP kiss: a pullback to CVWAP after the first breakout.
- The first VWAP breakout (buy or sell) has already happened.
- Price pulls back to CVWAP. A candle touches CVWAP but doesn't close beyond it. After a buy, it must not close below CVWAP. After a sell, it must not close above.
- Use that candle as your confirmation and enter on the break, with the same stop loss and target rules as above.
You give up the first move, but you trade in a direction the market has already confirmed once.
Chart 5: Crude oil buy on a VWAP kiss
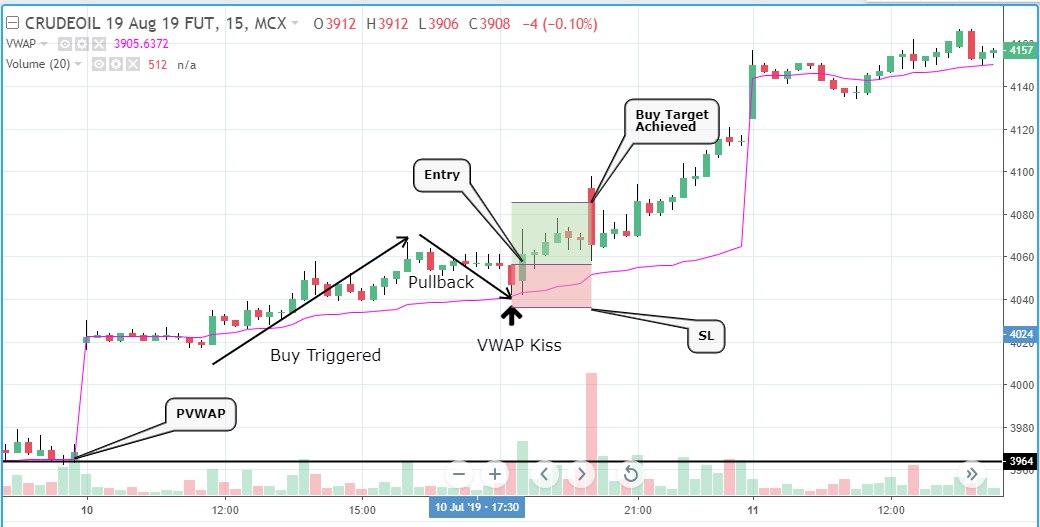
Chart 6: Nifty buy on a VWAP kiss
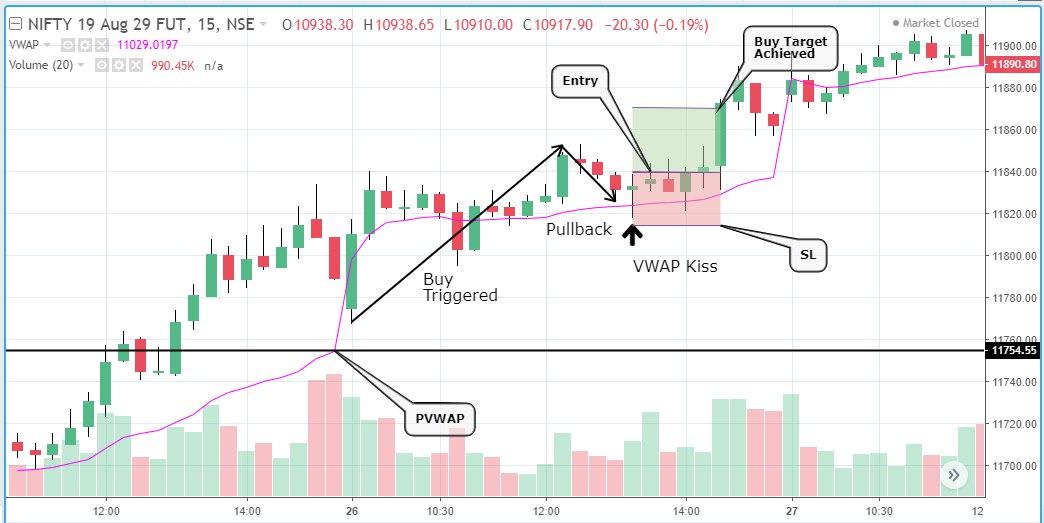
Chart 7: Bank Nifty sell on a VWAP kiss
Tips From Experienced VWAP Traders
Learn the basic rules first. These tweaks only make sense once you've traded the strategy consistently for a while.
- Ignore the candle colour. The original rules ask for a bullish confirmation candle for buys and a bearish one for sells. In practice, if every other condition is met, the trade can be taken whatever the colour (see Chart 5).
- An earlier VWAP touch counts. If a candle earlier in the day already touched CVWAP and closed on the right side, a later trigger doesn't need to touch CVWAP itself (see Chart 4).
- Use the VWAP kiss to avoid fake breakouts. Wait for the pullback instead of trading the first break (see Charts 5, 6 and 7).
When Not to Trade It
- Range-bound days. VWAP strategies struggle when price chops back and forth across the line. You can't know in advance that a day will range, but the day after a big trending day is often quieter, so many traders sit it out.
- Big scheduled news. Central bank decisions, major speeches and inventory reports can whip price through your stop in seconds. The original guide avoids index futures on central bank days and crude oil around the weekly inventory release. Check the Economic Calendar in Session Prep before you trade.
- Options charts. If you trade options, take entries and exits from the underlying instrument's chart, not the option's own chart.
VWAP Strategy FAQs
What's the win rate?
The strategy's authors report more than 60% winning trades over their own history, with a 1:1 risk to reward. At 1:1, anything above 50% is profitable before costs. Treat that as their result, not a promise: backtest it on your own market before you trust it.
Can I add other indicators?
You don't need to. VWAP already accounts for price, volume and time. If you like an extra filter, use it, but keep the core rules the same.
Should I take every signal?
The authors take every trade the rules generate, because skipping signals doesn't change the odds of the ones you take. Taking fewer is fine if it suits your risk appetite. Just be consistent.
Can I use a 5-minute or 3-minute chart?
There's no rule against it, but the strategy was built on 15 minutes. Backtest the lower timeframe first and only switch once the numbers hold up.
Which markets work best?
It works on all instruments, but best on fast-moving, liquid markets: major index futures, crude oil and high-beta stocks (stocks that move as much as or more than their index).
Track Your VWAP Trades in ETW Journal
A strategy is only as good as your records of it. Here's how to put this one to work in ETW Journal:
- Backtest it first. Replay your market bar by bar in ETW Journal's backtesting and log at least 30 VWAP setups before risking real money.
- Add it to your playbook. Create a "VWAP" playbook with the rules above as your checklist, and link every VWAP trade to it with one strategy tag.
- Tag the details. Tag each trade as breakout or VWAP kiss, and as trend day or range day. After a month you'll know which version works best for you.
- Review with screenshots. Save the chart with PVWAP, CVWAP, the confirmation candle and your entry marked, just like the charts above.
Ready to test the VWAP strategy? Open ETW Journal to backtest it, journal every trade and see your real win rate.
Strategy, charts and data originally compiled by @sanstocktrader, @CAtLarge, @ankurm84 and @blisstrades. This article is for education only and isn't financial advice. Trading involves risk, so only trade with money you can afford to lose.