 ETW

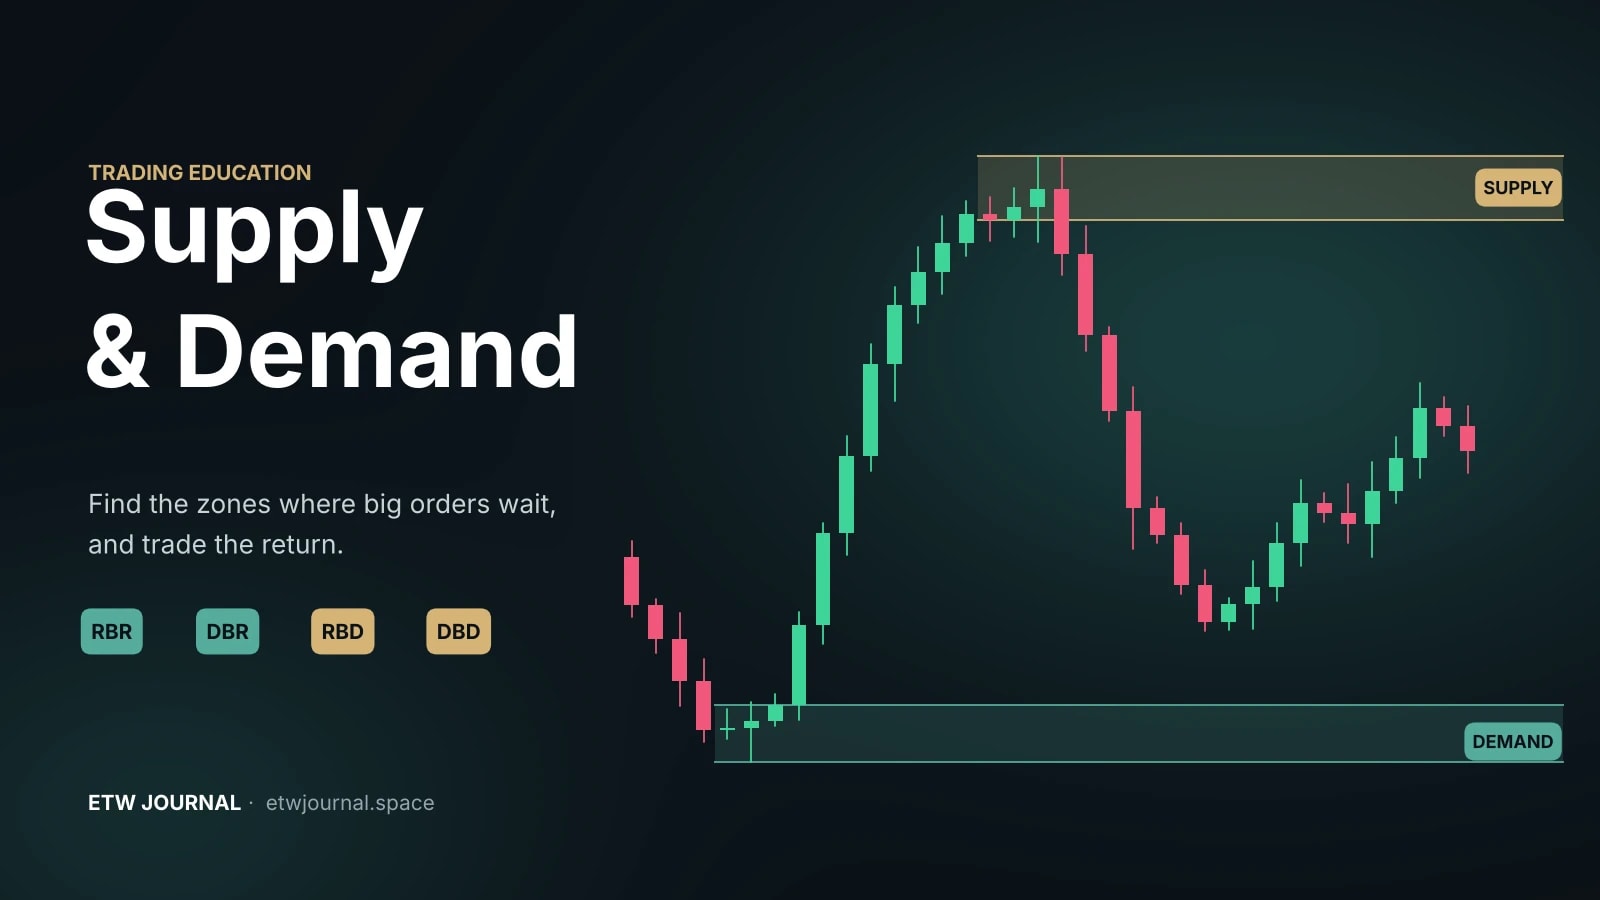
Price doesn't move at random between levels. It moves fastest away from places where big orders were left unfilled, and it often reacts when it returns to them. Those places are supply and demand zones. Once you can find them, draw them properly and trade the return with a clear stop, you have a complete, rules-based way to read any chart, on any pair, on any timeframe.
This guide walks through the whole process: what a zone actually is, the four formations that create one, how to draw it, which zones are worth trading, and where to enter, place your stop and take profit. It finishes with the trap that catches most breakout traders: the fakeout.
What supply and demand zones are
Every move on a chart is a fight between buyers and sellers. When price pauses in a tight range, the two sides are roughly in balance. That pause is called the base. When one side suddenly overwhelms the other, price leaves the base fast, and not every order sitting there gets filled.
- Rally: buyers outnumber sellers and price climbs.
- Drop: sellers outnumber buyers and price falls.
- Base: buyers and sellers are roughly equal and price goes sideways.
A demand zone is a base that price left with a strong rally: unfilled buy orders are likely still waiting there. A supply zone is a base that price left with a strong drop: unfilled sell orders are likely still waiting there. When price comes back, those orders can push it away again.
The four supply and demand formations
Every zone is a base sandwiched between two moves. Name the move into the base and the move out of it, and you get four formations:
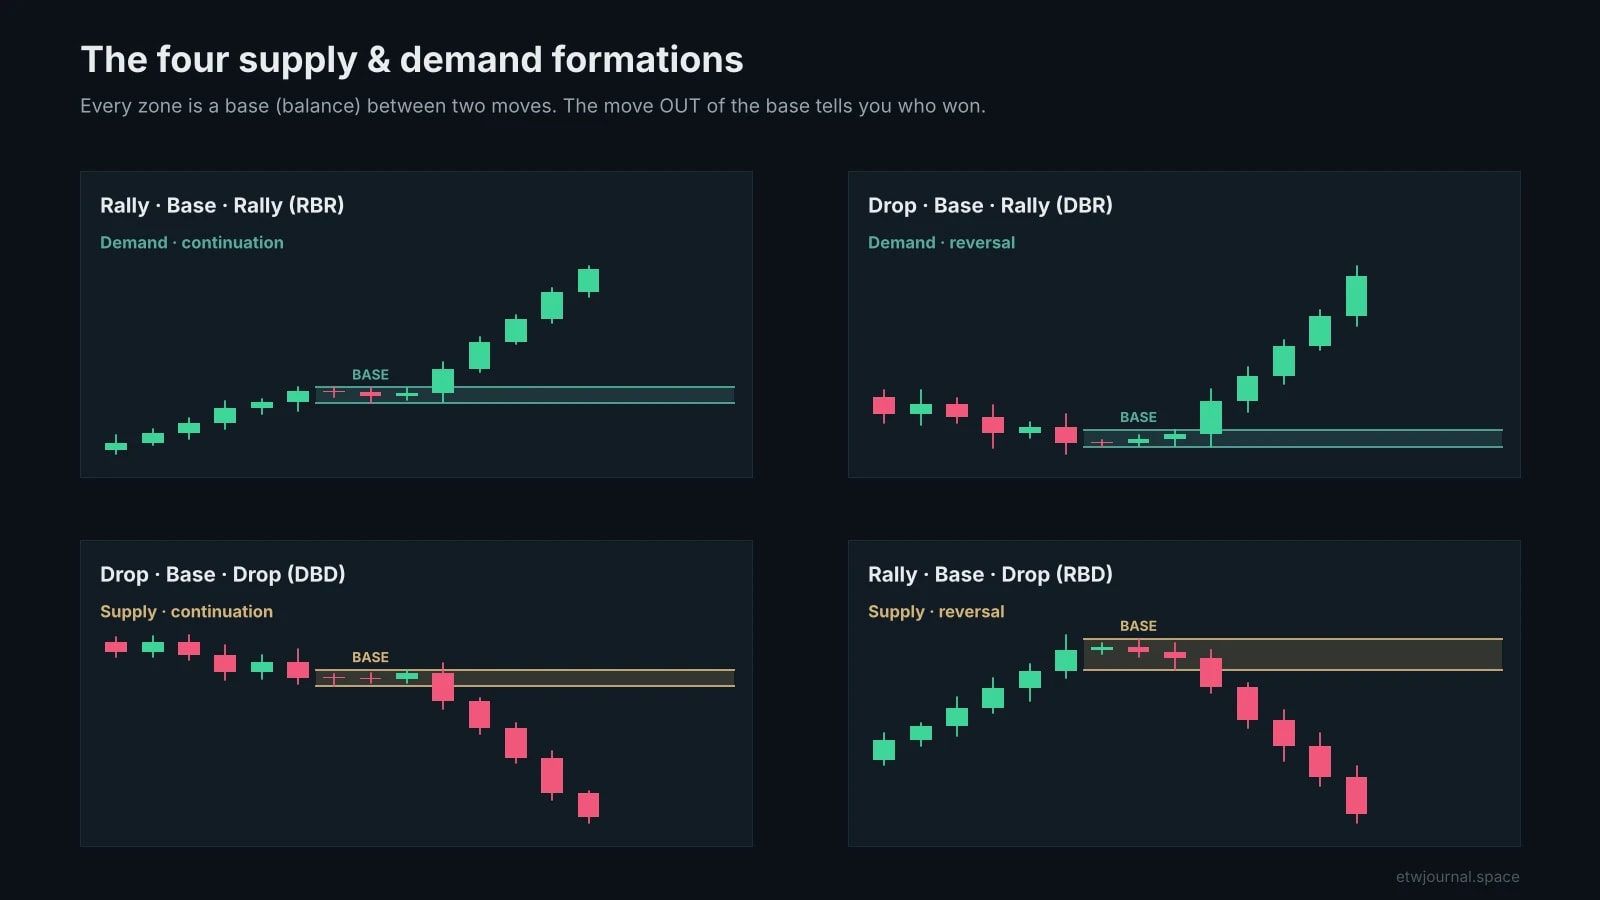
- Rally-Base-Rally (RBR): a demand zone in an uptrend. Price pauses, then keeps climbing. Continuation.
- Drop-Base-Rally (DBR): a demand zone that turns a downtrend around. Reversal.
- Drop-Base-Drop (DBD): a supply zone in a downtrend. Continuation.
- Rally-Base-Drop (RBD): a supply zone that turns an uptrend around. Reversal.
Continuation zones (RBR and DBD) trade with the trend, so they tend to be the easier ones to start with.
How to draw a zone
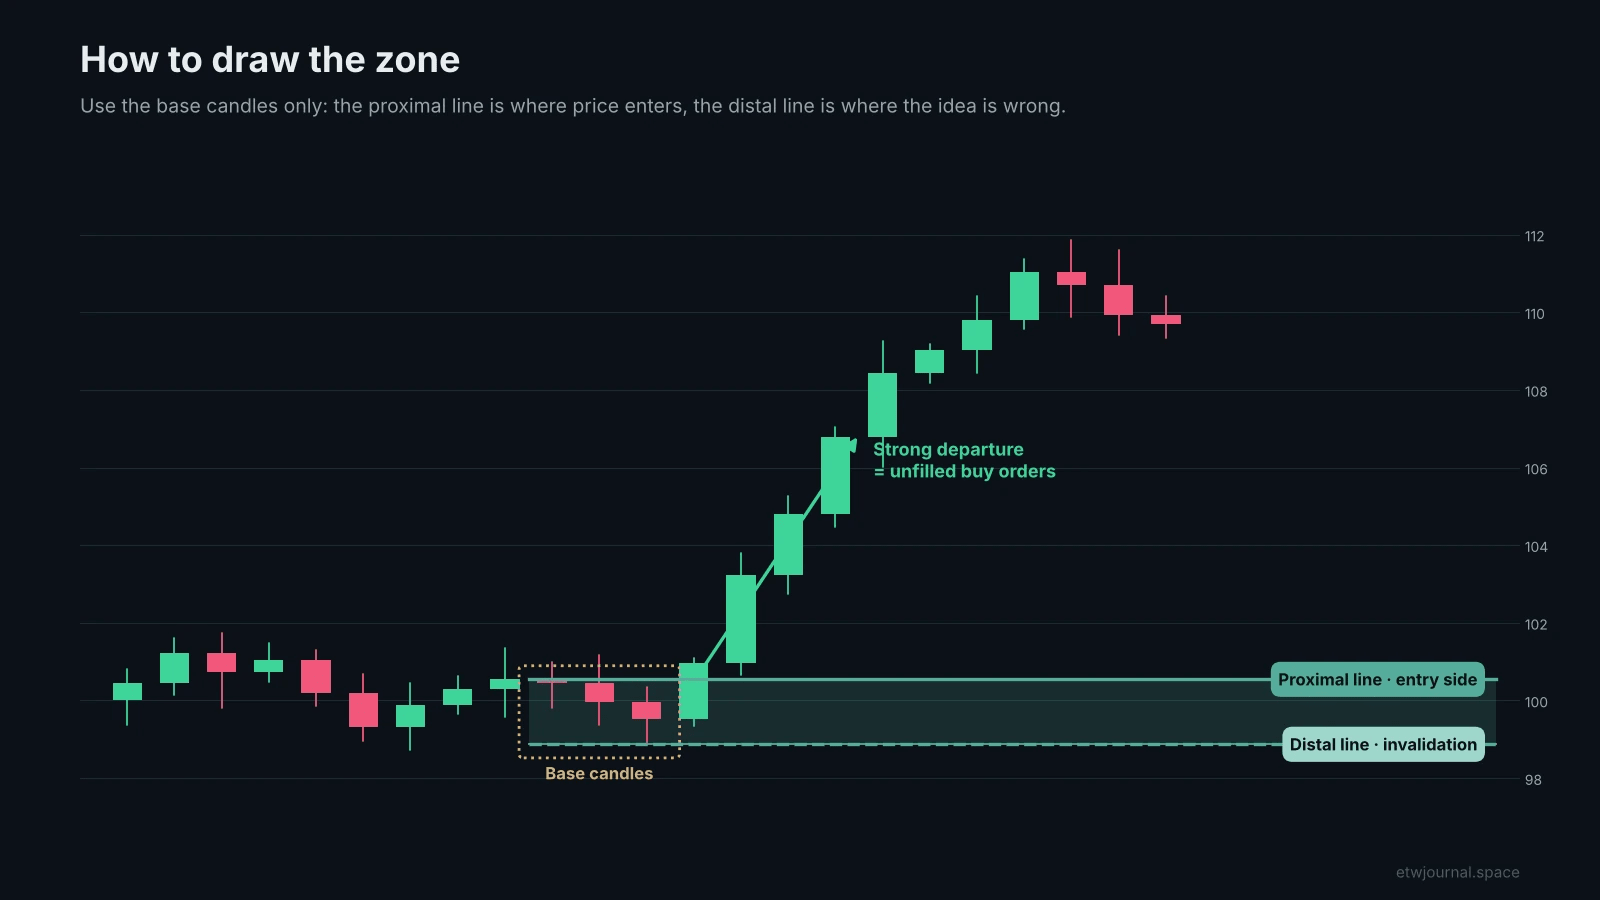
- Find the explosive move first. Look for large-bodied candles leaving an area quickly. No strong move, no zone.
- Find the base it came from. Usually one to six small-bodied, indecisive candles just before the move.
- Draw the proximal line, the edge of the base closest to current price. For demand, that's the highest candle body in the base; for supply, the lowest body.
- Draw the distal line, the far edge of the base. For demand, the lowest wick; for supply, the highest wick.
- Extend the zone to the right until price returns to it.
If you're unsure where the base is, look for the last indecisive candle (small body, wicks on both sides) right before the big move. Many traders anchor the zone on that single candle.
What makes a zone worth trading
Not every base deserves a trade. Score each zone on these points before you risk anything:
- Strength of the departure. The faster and bigger the move out of the base, the more unfilled orders were likely left behind.
- Time spent in the base. A short base (a few candles) is stronger than a long, drawn-out range.
- Freshness. The first return to a zone is the strongest. Each touch uses up orders, so most traders only take the first or second touch.
- Higher-timeframe agreement. A demand zone inside an H4 or daily uptrend is far more reliable than one fighting the bigger trend.
- Room to run. There should be enough space to the next opposing zone for at least twice your risk.
Where to enter a demand trade
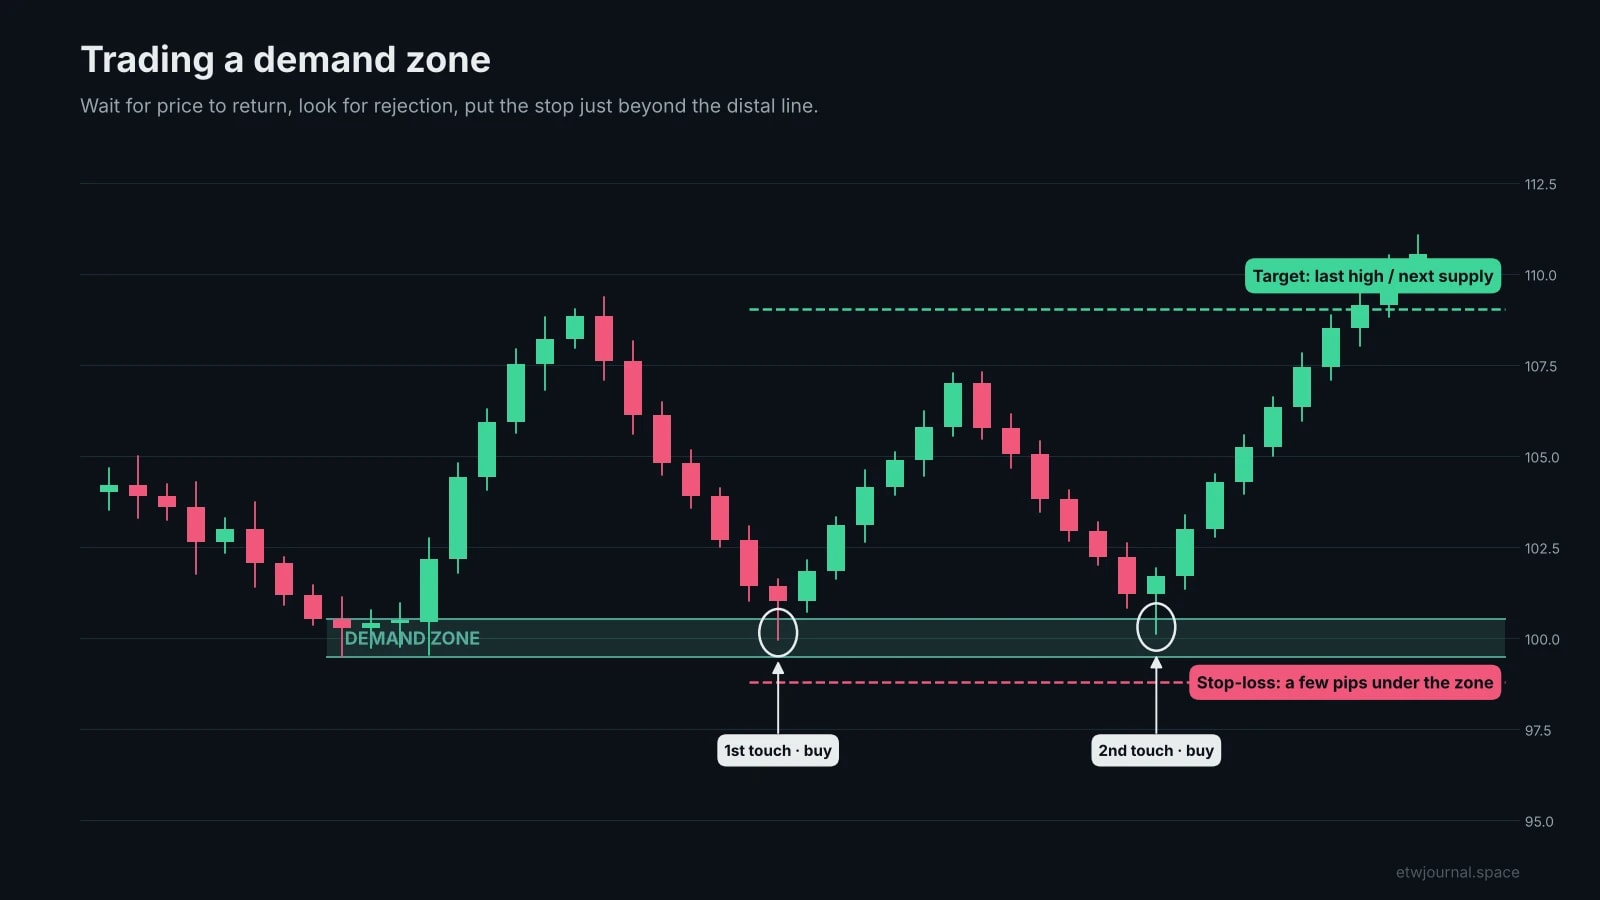
There are two common ways to enter:
- Limit order at the proximal line ("set and forget"). You get the best price and never miss the move, but you'll also be filled when the zone fails.
- Confirmation entry. Wait for price to reach the zone, then enter after a rejection candle (a long lower wick, or a bullish engulfing candle) on a lower timeframe. You give up a few pips for more evidence that buyers are still there.
Whichever you choose, stick to the first and second touches. By the third visit, most of the orders that made the zone special are gone.
Where to enter a supply trade
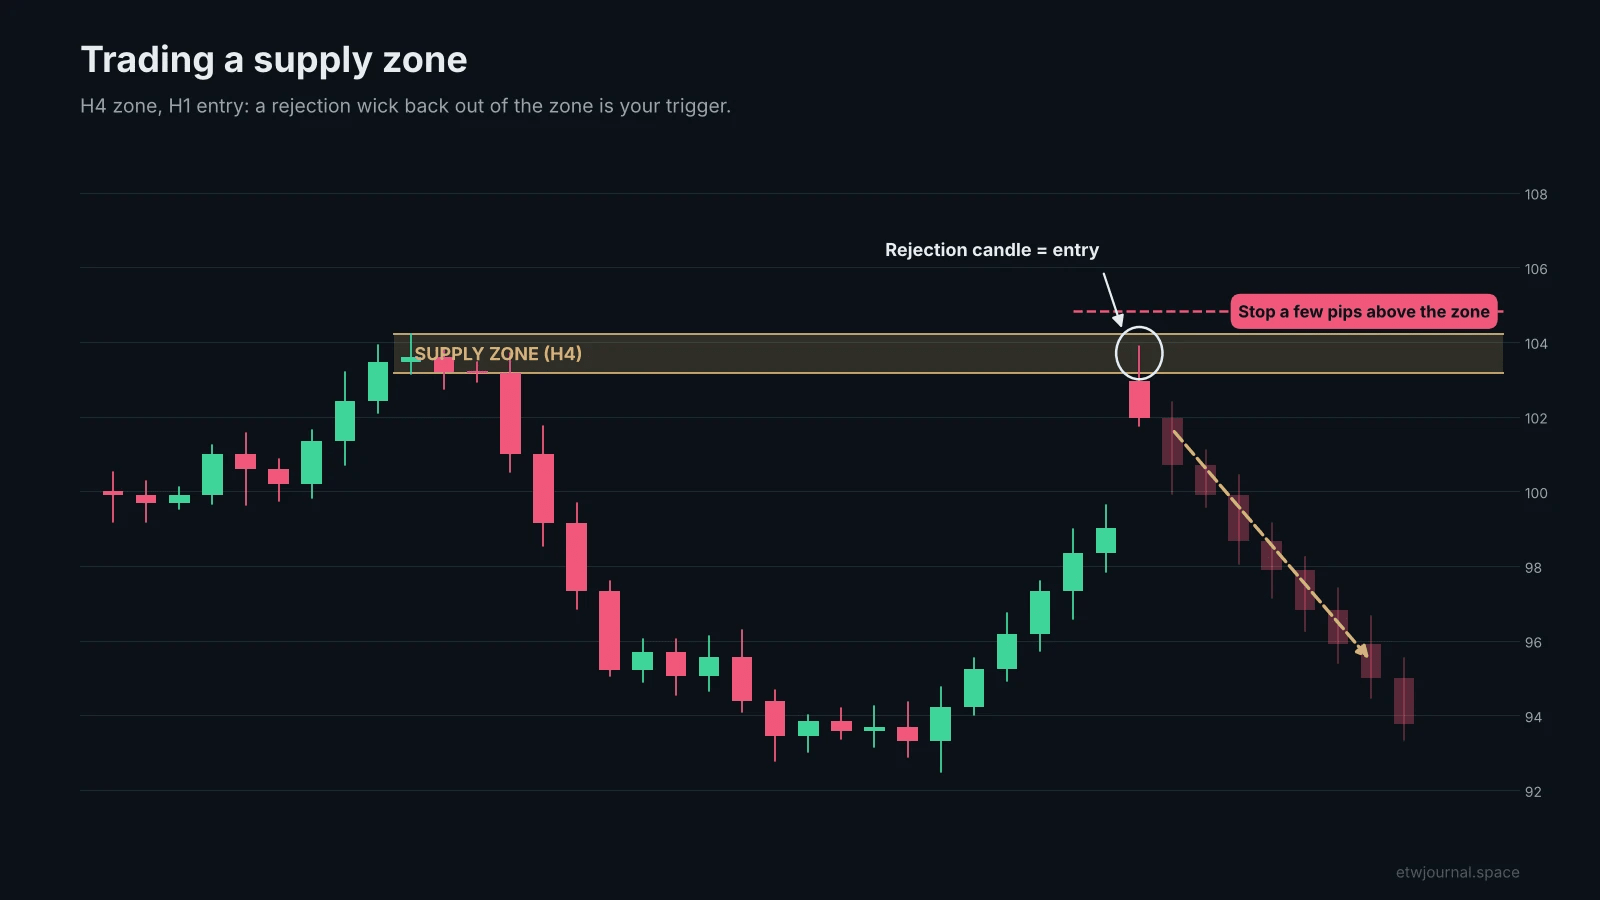
A clean way to trade supply is to mark the zone on a higher timeframe and time the entry on a lower one. Draw the zone on H4, then drop to H1 or M15 and wait for price to tag the zone and print a rejection: a long upper wick or a bearish engulfing candle. Enter on the next candle, with the stop just above the zone.
Stops and targets
- Stop-loss: just beyond the distal line, plus a buffer for the spread and normal noise. On major forex pairs that's often around 5–10 pips; on gold, indices or higher timeframes use a wider buffer, for example a fraction of the ATR.
- Target: the nearest opposing zone or the last swing high or low before price returned to your zone.
- Minimum reward-to-risk: aim for at least 1:2. If the next opposing zone is closer than that, skip the trade.
Never put your stop inside the zone. If price trades through the distal line, the orders you were counting on aren't there, and the idea is wrong.
Fakeouts: when a breakout is really a trap
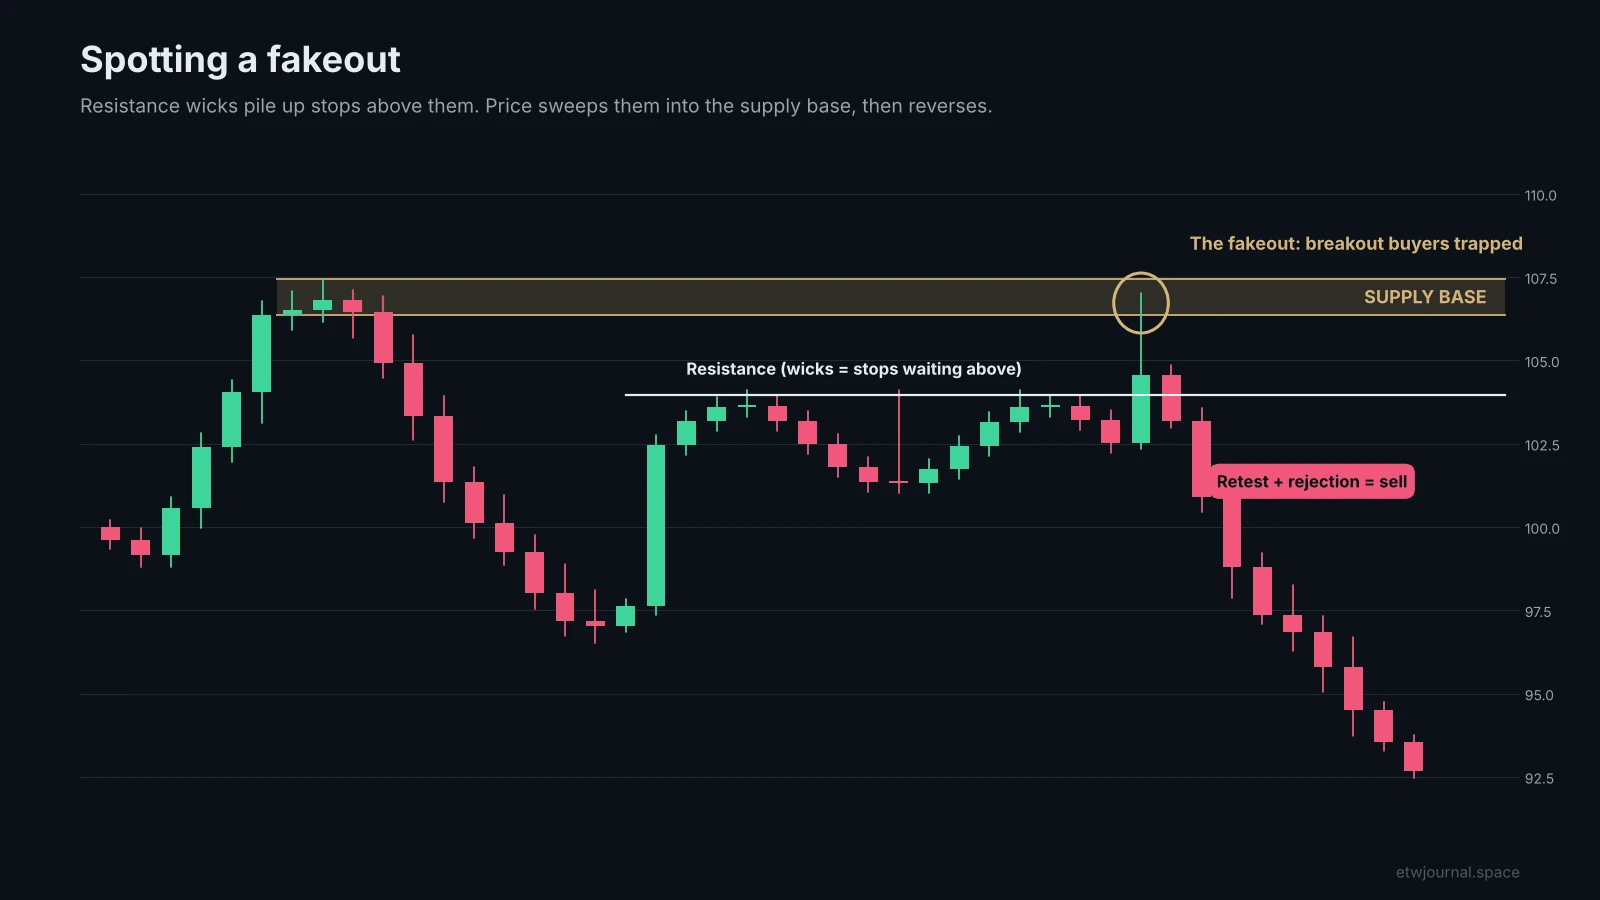
A fakeout (false breakout) happens when price pushes through obvious support or resistance, pulls in breakout traders, then reverses and runs their stops. With supply and demand, many fakeouts are predictable:
- Price ranges under resistance and leaves several wicks against it. Stops collect just above those wicks.
- Above the resistance sits an untested supply base.
- Price spikes through resistance into that supply base. Breakout buyers jump in, and their stops get triggered on the way back.
- Price falls back under resistance, retests it from below and rejects. That retest and rejection is the sell entry, with the stop a few pips above the resistance wicks.
The flip side works the same way for demand: a spike below support into a fresh demand zone, then a reclaim of support.
The fix for fakeouts is patience. Don't buy the first candle that breaks a level. Wait for the retest and a clear signal, and focus on two or three pairs so you learn how they usually behave around these levels.
Common supply and demand mistakes
- Marking a zone on every small pause instead of only the bases behind strong moves.
- Trading the third, fourth or fifth touch of a zone that's already been used up.
- Buying demand in a clear higher-timeframe downtrend (or selling supply in an uptrend).
- Placing the stop inside the zone, or with no buffer for the spread.
- Taking trades with no room to the next opposing zone.
- Not recording which zones actually worked, so the same mistakes repeat.
Track your supply and demand trades in ETW Journal
The fastest way to know whether supply and demand works for you is to measure it. In ETW Journal, your trades sync automatically from MT5, MT4, cTrader, TradeLocker or DXtrade, so you can spend your time on the review:
- Tag every trade with its formation (RBR, DBR, RBD, DBD), the touch number and the timeframe the zone came from.
- Compare tags in Tag Lab: see whether first-touch entries really beat second-touch entries, or whether continuation zones pay better than reversals for you.
- Turn the rules into a playbook checklist (fresh zone, HTF agreement, minimum 1:2) and check whether trades that followed it make more money.
- Practise in backtesting: replay any market bar by bar, mark zones as they form and trade them with risk-based sizing before you risk real money.
- Replay your real trades to see exactly how price reacted at your zone and whether your stop was in the right place.
Key takeaways
- A zone is a base that price left with a strong move; the move out tells you whether it's supply or demand.
- Draw it around the base candles only: proximal line for entry, distal line for invalidation.
- Favour fresh zones with strong departures that agree with the higher-timeframe trend.
- Enter on the first or second touch, keep the stop beyond the distal line and aim for at least 1:2.
- Expect fakeouts around obvious levels, and wait for the retest instead of chasing the break.
This article is for education only and isn't financial advice. Trading forex and CFDs carries a high risk of loss.