 ETW

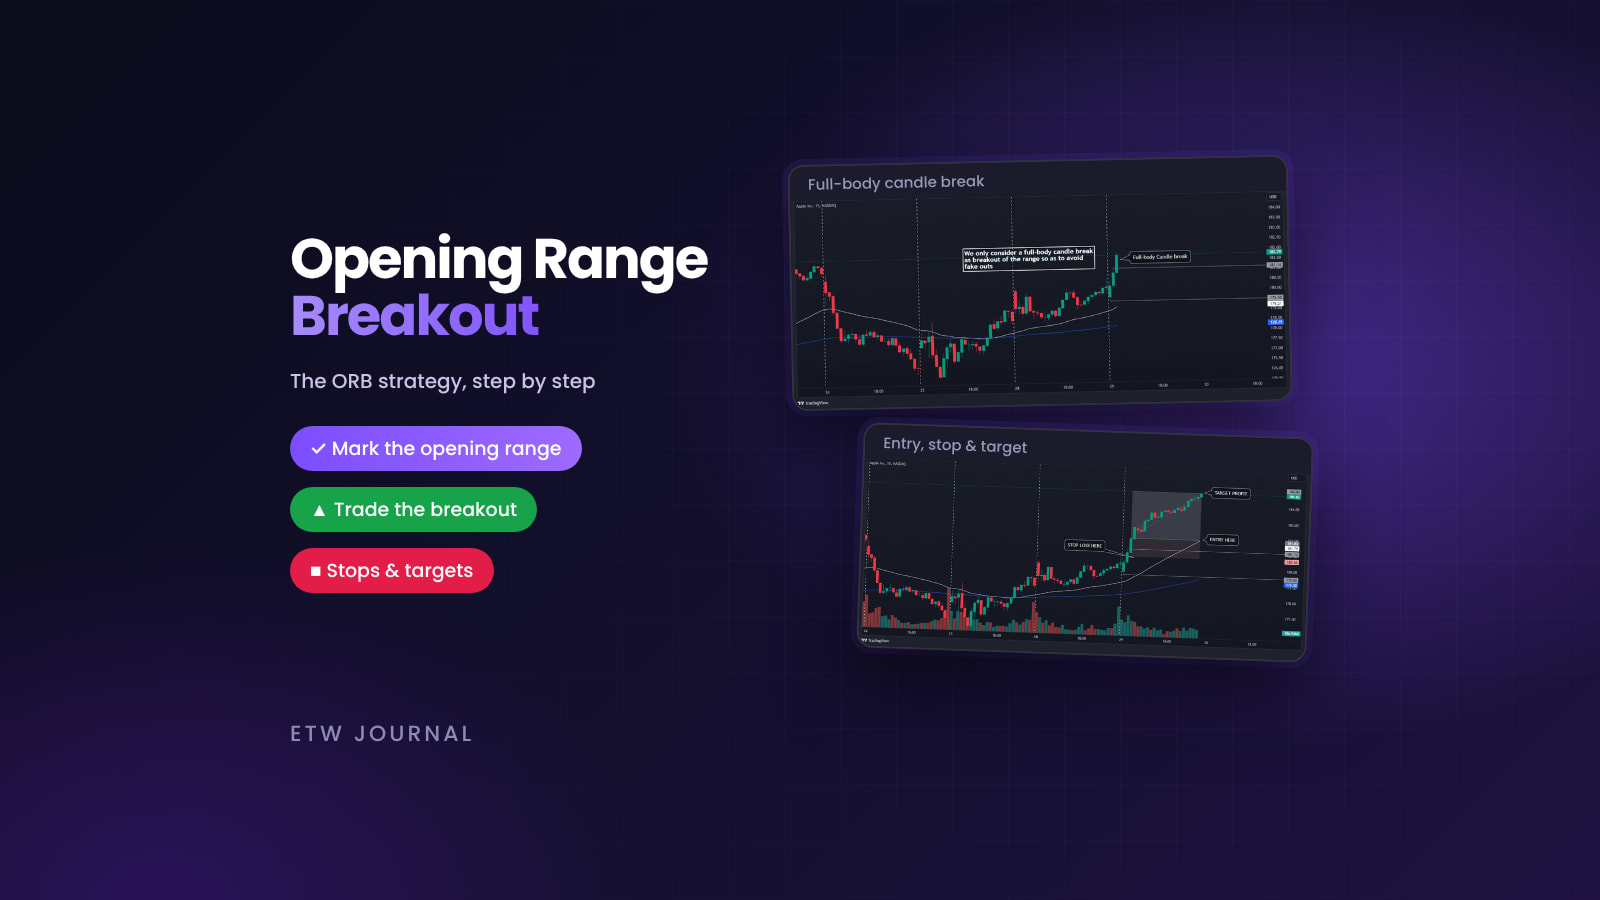
The first hour of the trading day is when volume and volatility are at their highest. Overnight news gets priced in, big orders hit the market and price often picks a direction for the rest of the session. The opening range breakout (ORB) strategy is built to take advantage of exactly that. This guide explains what the opening range is, how to measure it, which markets and timeframes suit it, and a complete 4-step ORB setup you can backtest and journal.
What is the opening range breakout (ORB) strategy?
The idea is simple. You let the market trade for a fixed amount of time after the open, mark the high and low of that period (the opening range), and then trade the break of that range. A break above the high is a buy signal; a break below the low is a sell signal.
The approach goes back to the 1960s, when trader Arthur Merrill used it on the Dow Jones Industrial Average, and it became popular in the 1990s. Back then the opening range was usually the first hour of trading. Today, with faster data and shorter charts, many traders use the first 30, 15 or even 5 minutes.
Why does it work? The open is where liquidity and volatility peak. The range that forms in those first minutes shows where early buyers and sellers agree on value. When price escapes that range with conviction, it often means one side has taken control, and that move can run for much of the session.
How to measure the opening range
There are two common ways to define the range.
Method 1: last candle of yesterday + first candle of today
This method uses two candles. The first is the final candle of the previous session, which shows where price closed. The second is the first candle of the new session, which captures the initial reaction to overnight news. The range runs from the highest high to the lowest low of those two candles.
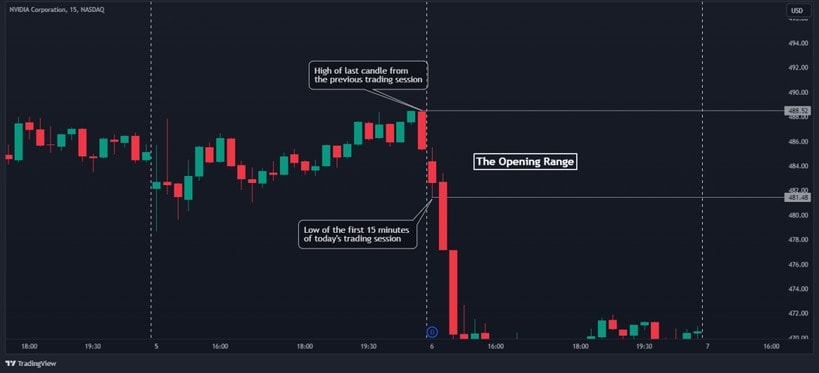
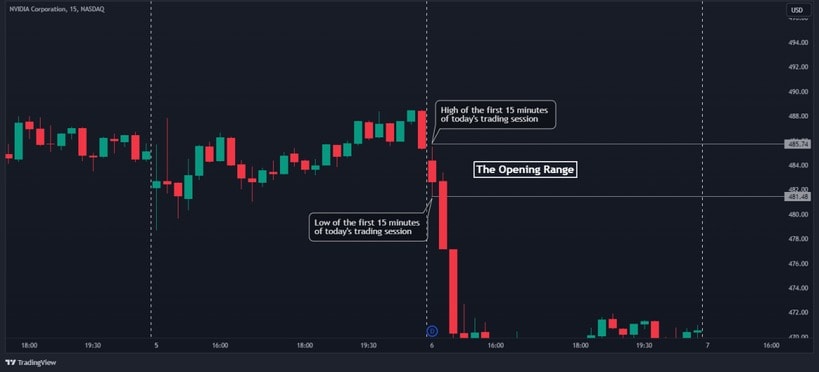
Method 2: high and low of the first X minutes
The more common method is to simply mark the highest high and lowest low of a fixed window after the open, for example the first 15 or 30 minutes. Those two levels become your reference points for the rest of the day, and a break of either one is your signal.
Which timeframe is best for ORB?
Because you are trading the first 15 minutes to the first hour of the session, lower timeframes work best. The 5-minute, 15-minute and 30-minute charts are the most popular. A 4-hour chart would swallow the whole opening range in a single candle, so it isn't useful for this strategy.
Multiple timeframe analysis helps a lot here. Use a higher timeframe (1-hour or daily) to find the trend, then trade the opening range on the lower timeframe only in that direction.
Which markets suit ORB best?
ORB works best in markets with a clear daily open and close, because the open is what creates the burst of volume the strategy relies on. That makes it a natural fit for:
- Stocks, especially liquid large caps that react strongly to news.
- Index and commodity futures such as the Nasdaq, S&P 500, crude oil and gold around their session opens.
- CFDs on those same stocks and indices.
Forex is trickier because the market trades around the clock with no single open. Forex traders usually adapt ORB by using the opening of a major session, such as London or New York, as their open instead.
Tools: you don't have to draw the range by hand. TradingView has several community ORB indicators (search ORB in the indicators menu), and third-party ORB indicators are available for MT4 and MT5. Some traders also use an ORB calculator to work out the range, stop and targets automatically.
How to trade the ORB strategy: 4 steps
Here is a complete ORB setup on a 15-minute Apple (AAPL) chart, putting all the pieces together.
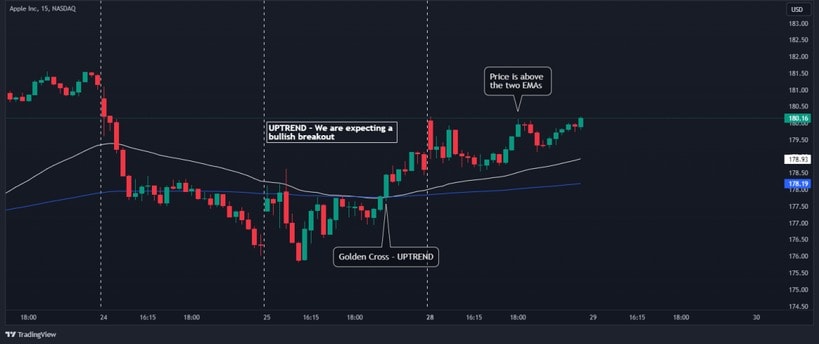
Step 1: Find the trend with the 50 and 200 EMA
Only trade breakouts in the direction of the bigger trend. A simple filter is the 50 and 200 exponential moving averages:
- When the 50 EMA crosses above the 200 EMA (a golden cross) and price is above both, the trend is up. Look for upside breakouts only.
- When the 50 EMA crosses below the 200 EMA (a death cross) and price is below both, the trend is down. Look for downside breakouts only.
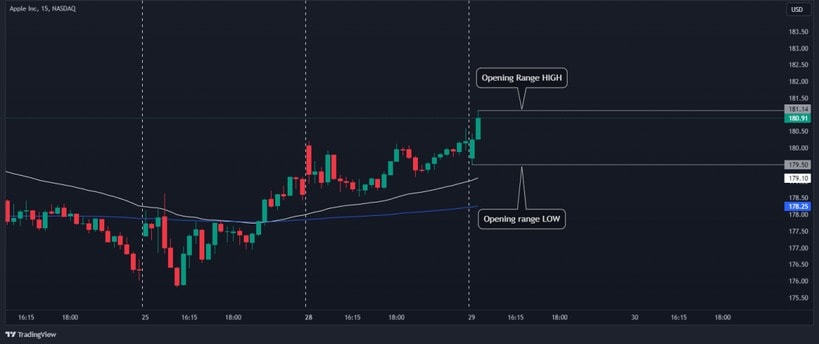
Step 2: Plot the opening range
There is no single correct window. Some traders use the first 5 minutes, others 15 or 30. In this example the high and low of the first 30 minutes of the session are used to draw the range.
Step 3: Wait for a confirmed breakout
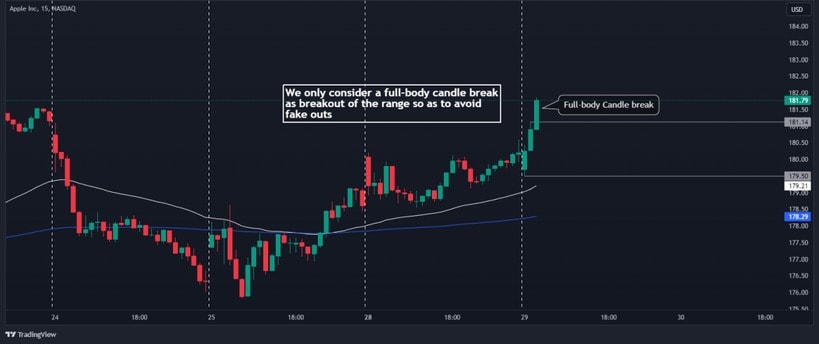
Since the trend is up, you only wait for a break of the opening range high. Don't just place a buy stop on the high, because wicks through the level often reverse. Instead, wait for a full-body candle to close beyond the range. This filters out many fakeouts.
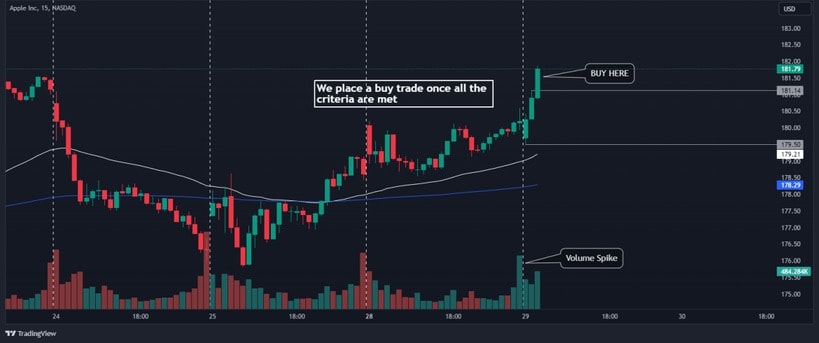
Then check volume. A genuine breakout usually comes with a clear volume spike. When the trend, the full-body break and the volume all line up, you take the trade.
Step 4: Set your stop loss and target
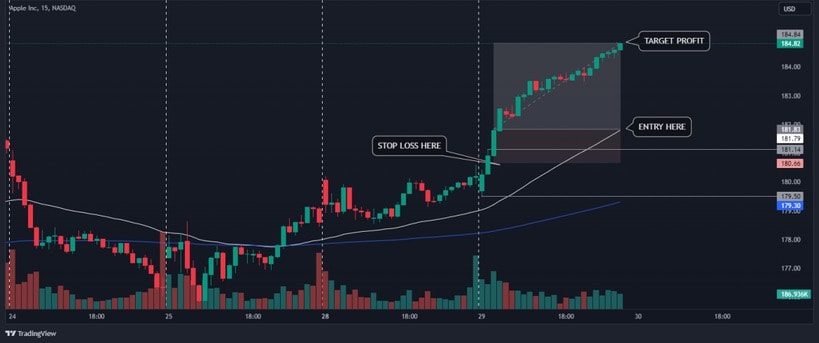
There are two common places for the stop:
- Below the breakout candle. A tighter stop with a better reward-to-risk ratio, but more likely to be hit by noise.
- At the other side of the opening range. A wider, more conservative stop that gives the trade more room.
For the target, aim for 2 to 3 times your risk (2R to 3R).
Is the ORB strategy profitable?
Traders who use ORB often report win rates somewhere between 40% and 65%, but those numbers vary a lot by market, timeframe and rules, and they come from traders' own experience rather than a guarantee. Win rate alone doesn't tell you much anyway. A strategy that wins 45% of the time can be very profitable if the average winner is 2 to 3 times the average loser.
What makes ORB work over time is the same as any strategy: a clear trend filter, strict entry confirmation, a fixed stop and consistent position sizing. Market conditions also change. ORB tends to shine on news-driven, trending days and struggle on quiet, choppy ones.
Common ORB mistakes: trading breakouts against the trend, entering on a wick instead of a candle close, ignoring volume, using a range that is too wide to give a sensible stop, and trading every day even when the open is quiet.
How to start trading ORB
- Pick your market. Choose liquid stocks or futures with a clear daily open. A screener can help you find names with enough volume and volatility.
- Fix your rules. Decide your range window (5, 15 or 30 minutes), trend filter, entry trigger, stop placement and target before the session starts.
- Backtest first. Replay past sessions and see how your exact rules would have performed.
- Journal every trade. Track results by range size, time of day and market to find where your edge really is.
Backtest and journal your ORB trades in ETW Journal
ETW Journal makes the last two steps easy. Use the backtesting workspace to replay the open bar by bar and practise your ORB rules on stocks, indices and futures before risking money. Then tag your live trades as ORB, note the range window you used and whether the trend filter and volume confirmation lined up, and attach a screenshot of the range. After a few weeks your analytics will show which version of ORB actually makes you money.
Charts in this guide are from the HowToTrade guide on the Opening Range Breakout (ORB) Trading Strategy.