 ETW

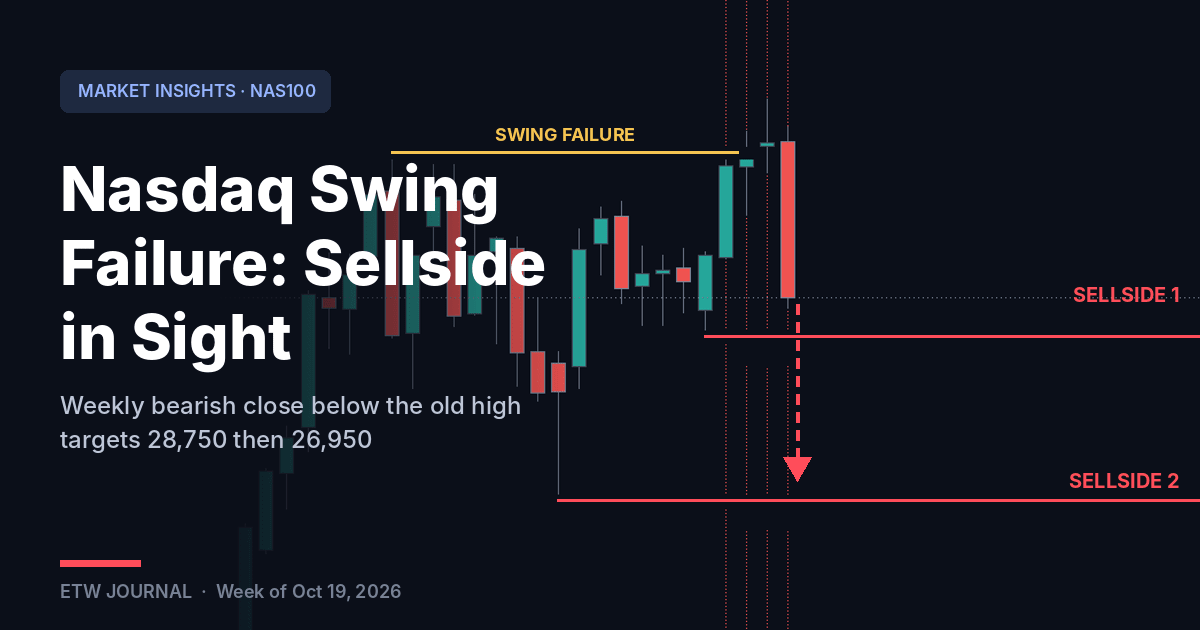
The Nasdaq 100 just printed one of the clearest bearish signals a weekly chart can give: a swing failure at the highs, followed by a strong bearish close. Going into next week, our bias is lower, and we expect price to go after the sellside liquidity sitting beneath the market.
Here is what happened, why it matters, and the levels we are watching.
What happened this week
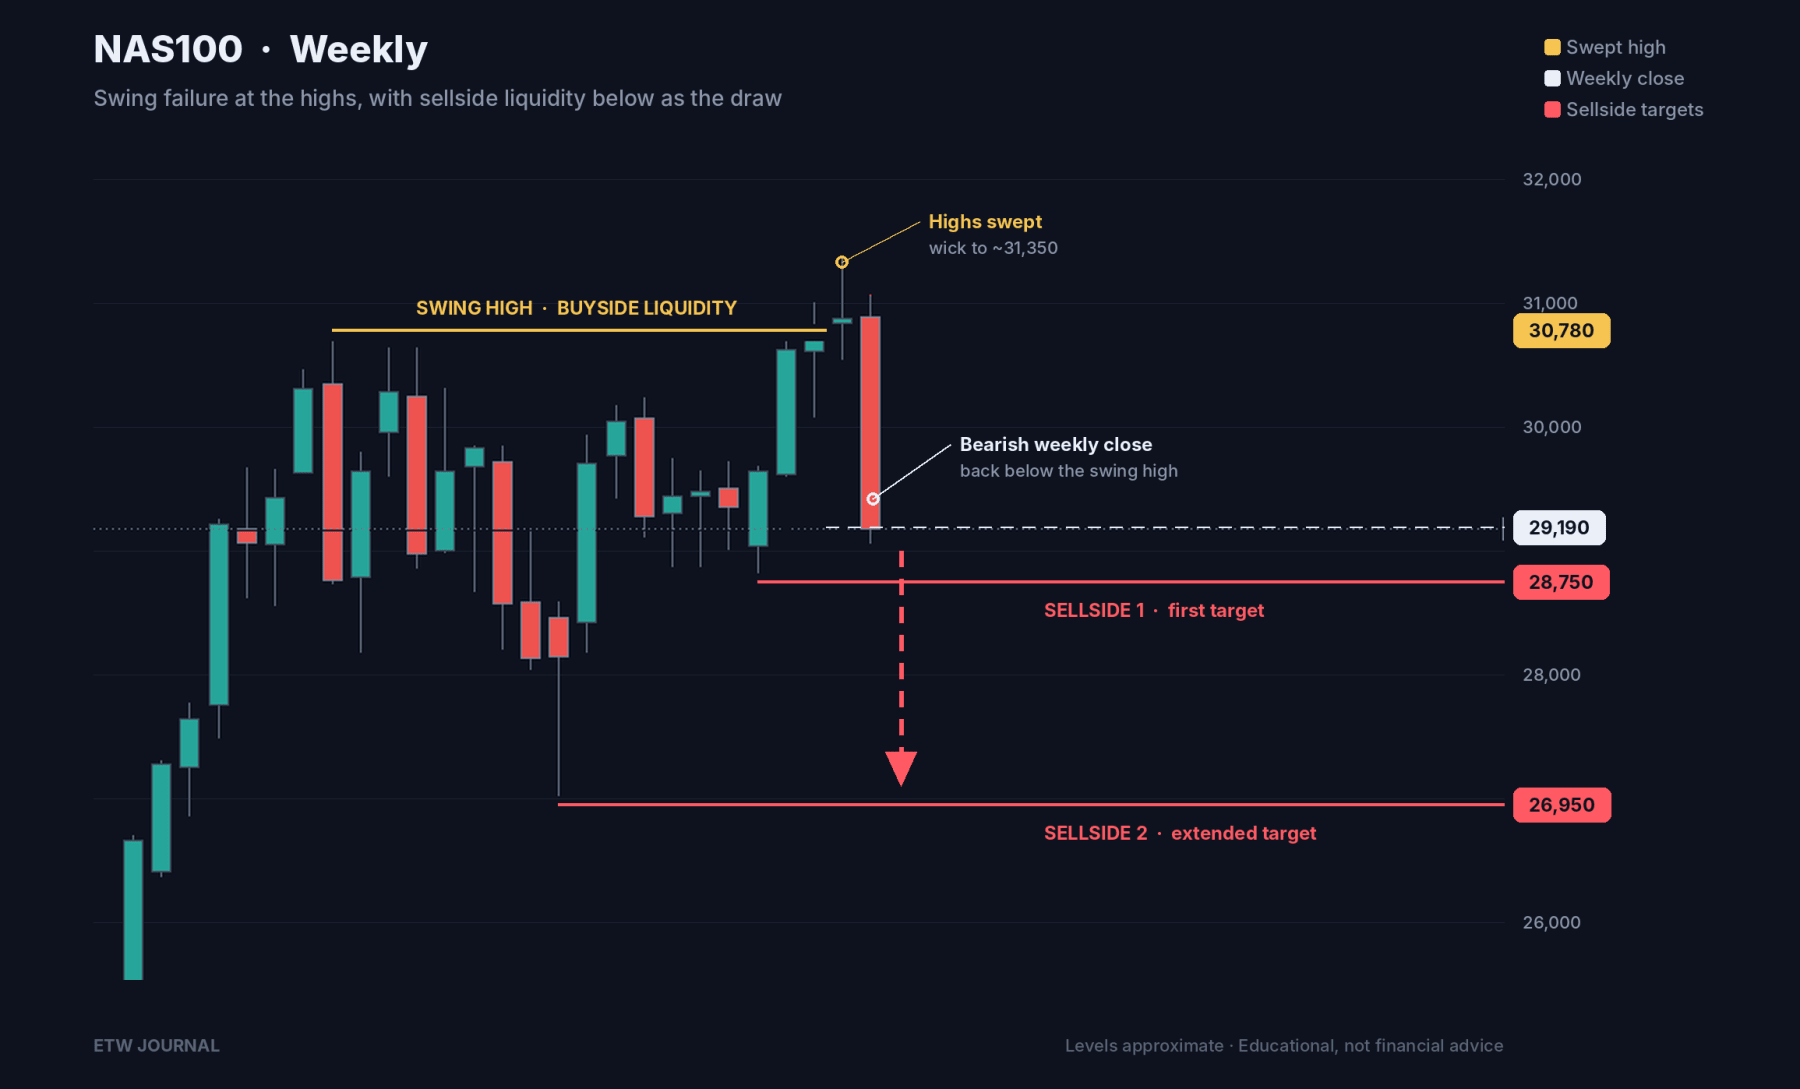
For several weeks, NAS100 ranged below a clear weekly swing high around 30,780. A level that obvious attracts liquidity: traders who are short place their stop-losses just above it, and breakout traders place buy orders there.
Over the last few weeks, price pushed above that high and wicked as far as roughly 31,350. On the surface that looked like a bullish breakout.
Then this week's candle told a different story. It opened near the highs and closed sharply lower at about 29,190, well back inside the old range and below the swing high it had just broken. It is a large-bodied bearish candle that wiped out several weeks of gains in one week.
What is a swing failure?
A Swing Failure Pattern (SFP) happens when price trades beyond a previous swing high (or low) but fails to hold there and closes back inside.
The idea is simple:
- Liquidity rests above old highs. Buy-stops from shorts and breakout buy orders pile up there.
- Price runs that liquidity. The move above the high triggers those orders, which gives larger participants the liquidity they need to sell into.
- The close reveals intent. If price can't stay above the high and closes back below it, the breakout was a trap. The buyers who chased it are now trapped and become fuel for the move down.
That is exactly what this week's weekly candle shows. The buyside was taken, the breakout failed, and the close was decisively bearish.
Where price is likely headed: the sellside targets
When buyside liquidity has been taken and price rejects, the market usually draws toward the opposite pool of liquidity: the sellside resting below recent lows. On the chart there are two clear targets.
Target 1: Sellside around 28,750
This is the most recent swing low, created just before the final push into the highs. Sell-stops from traders who bought that rally sit below it. It is the nearest draw on liquidity and the first level we expect price to reach next week.
Target 2: Sellside around 26,950
This is the deeper swing low inside the range, the wick low that launched the last leg up. If Target 1 is taken and bearish momentum continues, this is the next major pool of sellside liquidity. It may not be reached in a single week, but it is the larger objective for this move.
The plan for next week
- Bias: Bearish while price stays below this week's high and the swept swing high (~30,780).
- First objective: The sellside around 28,750.
- Extended objective: The sellside around 26,950.
- Approach: On lower timeframes (daily, 4H), look for retracements into premium, such as bearish fair value gaps or order blocks formed by this week's selloff, to position in line with the weekly bias instead of chasing price lower.
- Invalidation: A strong move back above the swept highs, and especially a weekly close back above ~30,780, would weaken the swing-failure idea and call for a fresh read.
Key takeaways
- NAS100 broke above a clear weekly high, then closed back below it with a large bearish candle. That is a weekly swing failure.
- The buyside liquidity above the high has been used; the market's next likely draw is the sellside below.
- Watch 28,750 first, then 26,950.
- Let lower-timeframe price action confirm entries, and respect invalidation above the highs.
This analysis is for educational purposes only and is not financial advice. Trading indices involves substantial risk. Always manage your risk and do your own research.