 ETW

Ask ten traders what their strategy is and most of the answers will lean on the same idea: price remembers where it turned before. Support and resistance are the most practical tools in technical analysis, and almost everything else, from chart patterns to supply and demand zones, is built on top of them. This guide covers what they are, why they work, how to draw them properly and how to actually trade them.
What are support and resistance?
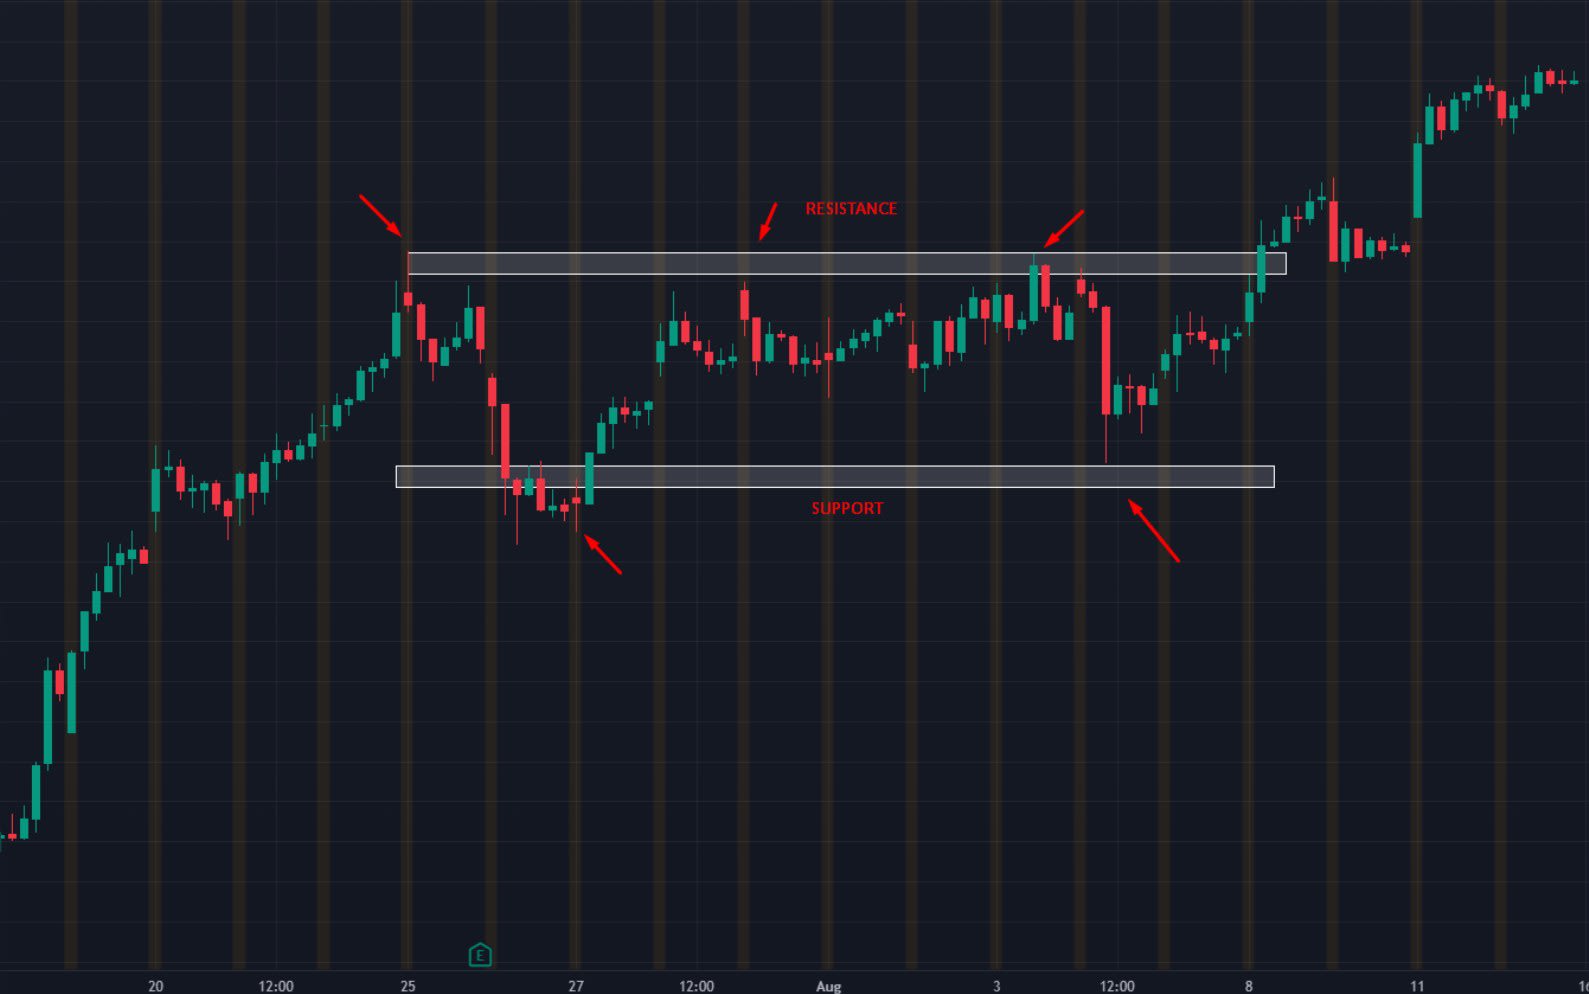
Support is a price area below the market where buying has been strong enough to stop a fall. When price drops into it, traders see value and start buying, and that buying halts the decline and often pushes price back up.
Resistance is the mirror image: an area above the market where selling has been strong enough to stop a rally. When price rises into it, traders take profits or open shorts, and that selling stalls the move and often turns price lower.
Why support and resistance matter
- Almost every trading system uses them. Whether you trade price action, ICT concepts, supply and demand or indicators, your model eventually needs to know where price is likely to react.
- They define market structure. Highs and lows, trends and ranges are all described in terms of where support and resistance sit and whether they hold or break.
- They give you a trade plan. A good level tells you where to enter, where your idea is wrong (your stop loss) and where the next obstacle is (your target).
Do they really work?
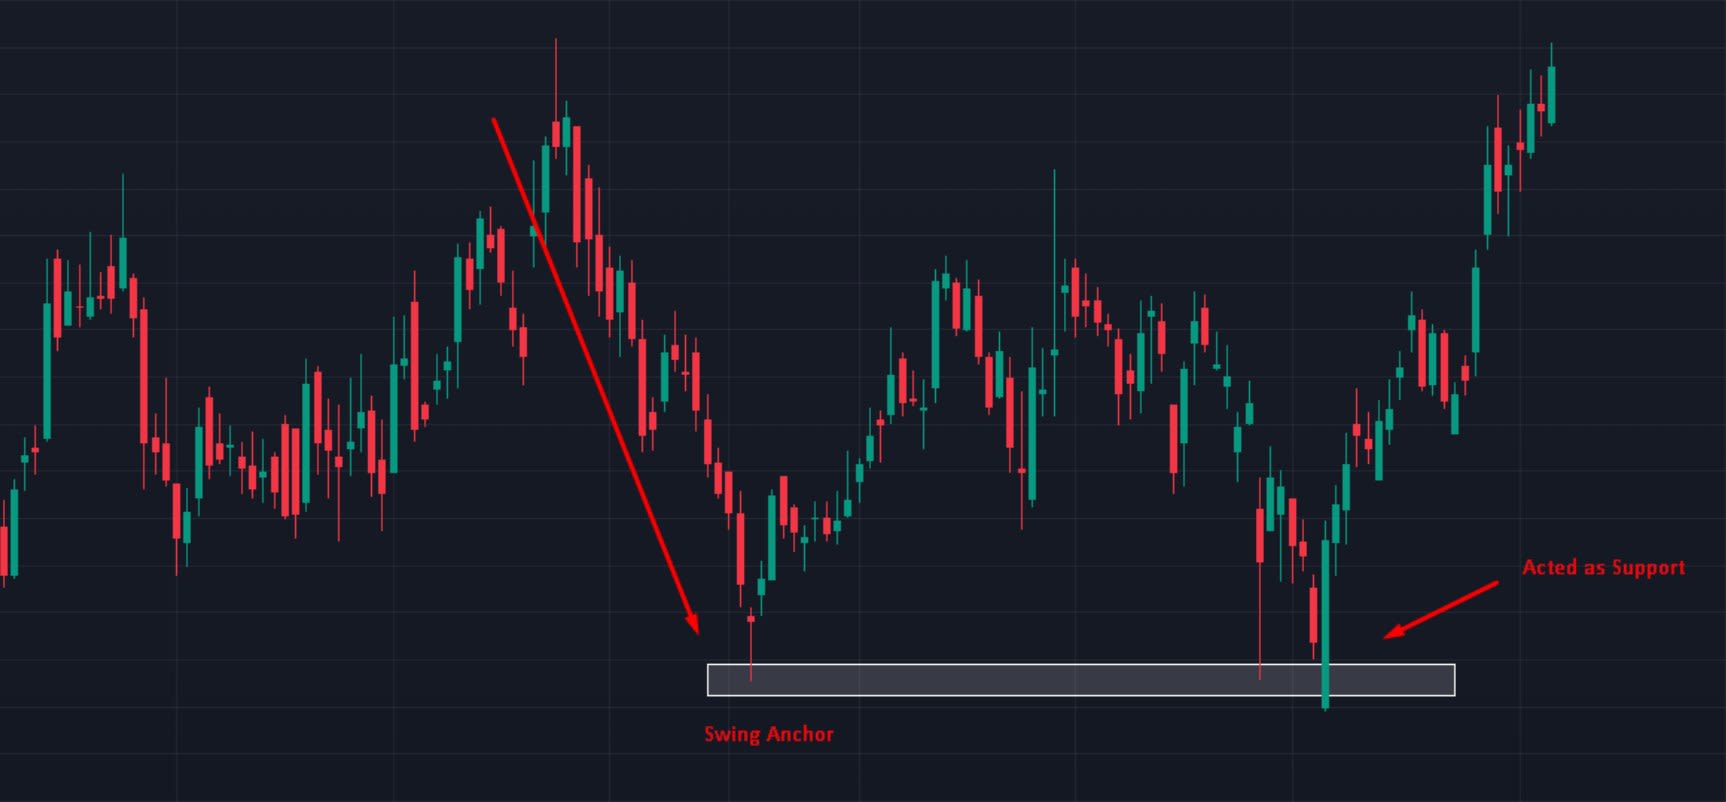
Look at any downtrend making lower highs and lower lows. At some point the selling simply stops, and price goes sideways or reverses. That turning point is not random. It is a swing low where enough demand showed up to absorb the selling, and it becomes an anchor point that traders watch the next time price returns.
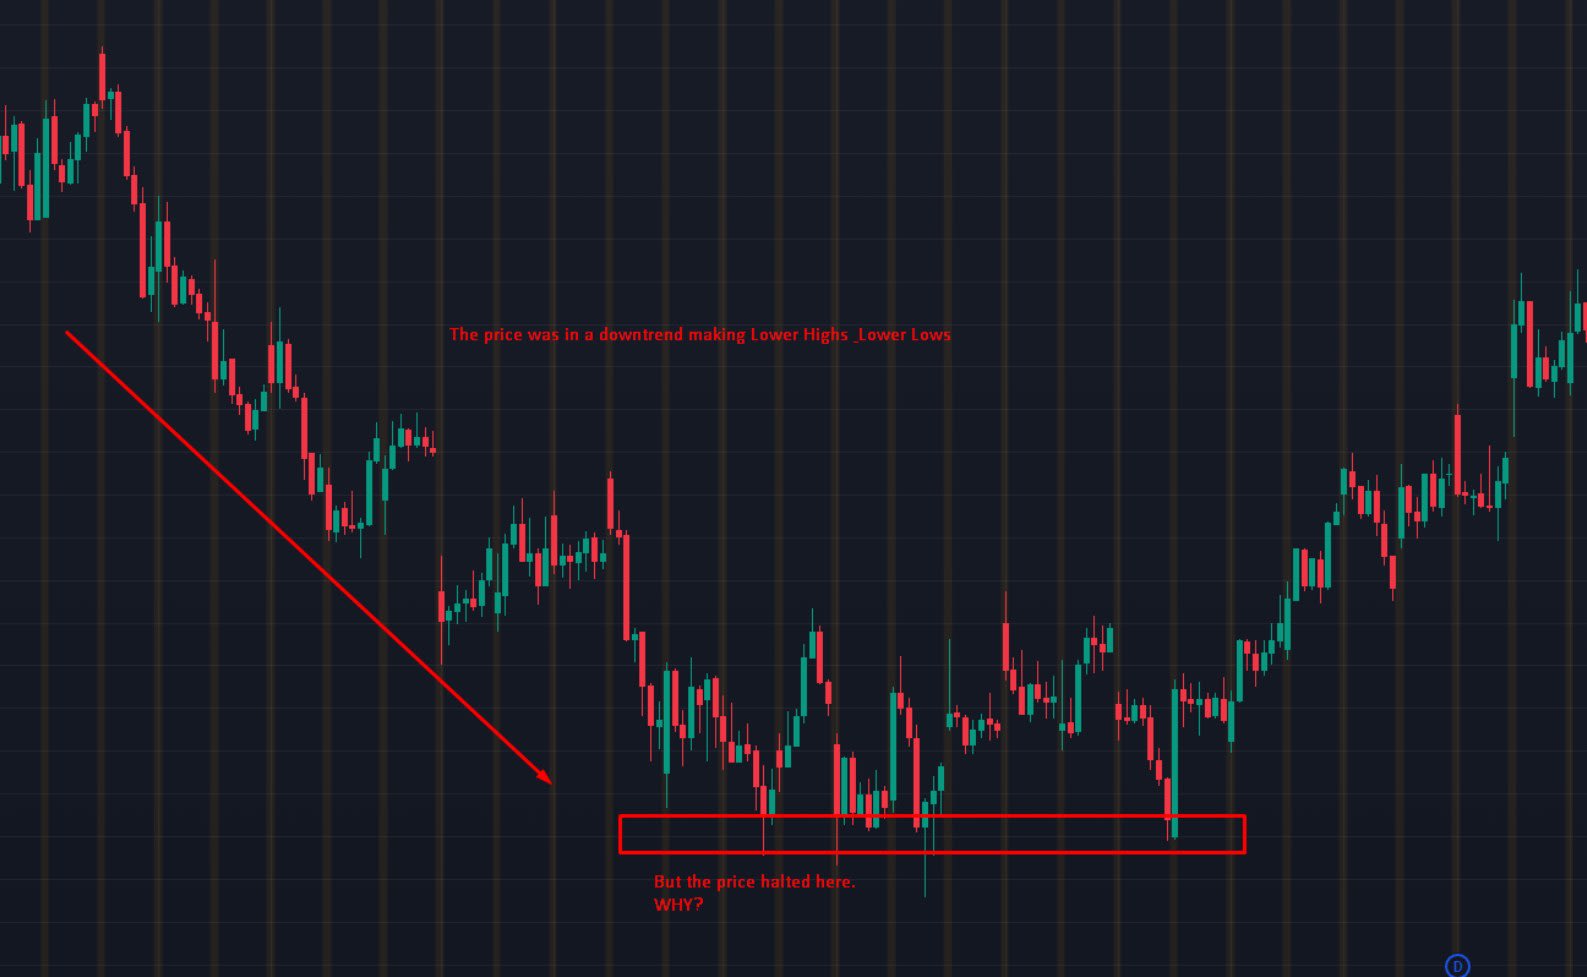
These anchor points are created by the larger participants who move the market. Once a swing low has proven it can halt a decline, traders expect demand to be waiting there again, and they act on that expectation, which is exactly what makes the level hold.
The psychology behind every level
At any key level there are three groups of traders:
- Longs who bought and are waiting for price to rise.
- Shorts who sold and are hoping price keeps falling.
- Traders on the sidelines who haven't decided yet.
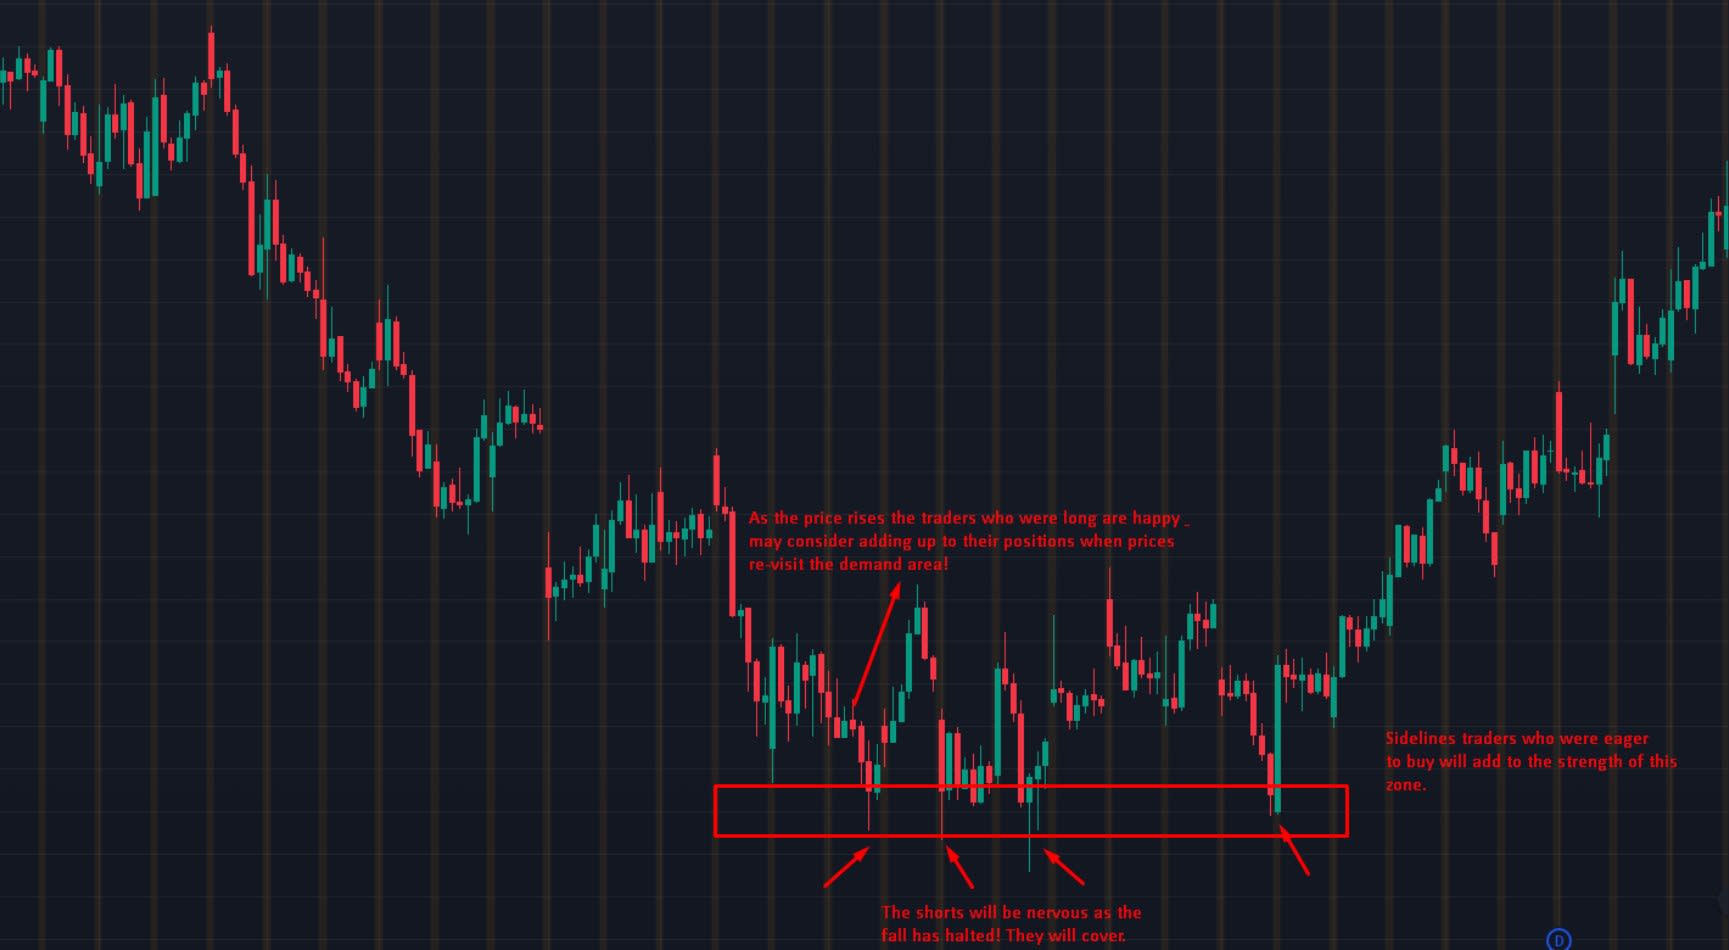
Here is what happens when price bounces from a demand area. The longs are happy and plan to add to their positions if price comes back. The shorts get nervous because the fall has stopped, so they buy to cover. The sidelined traders who wanted to buy now have a level to buy at. All three groups end up buying in the same place, which is why the zone gets stronger.
Resistance works the same way in reverse. Longs get nervous when price stops rising, short sellers add to their positions because they see a correction coming, and traders on the sidelines jump in short as well, fuelling the drop.
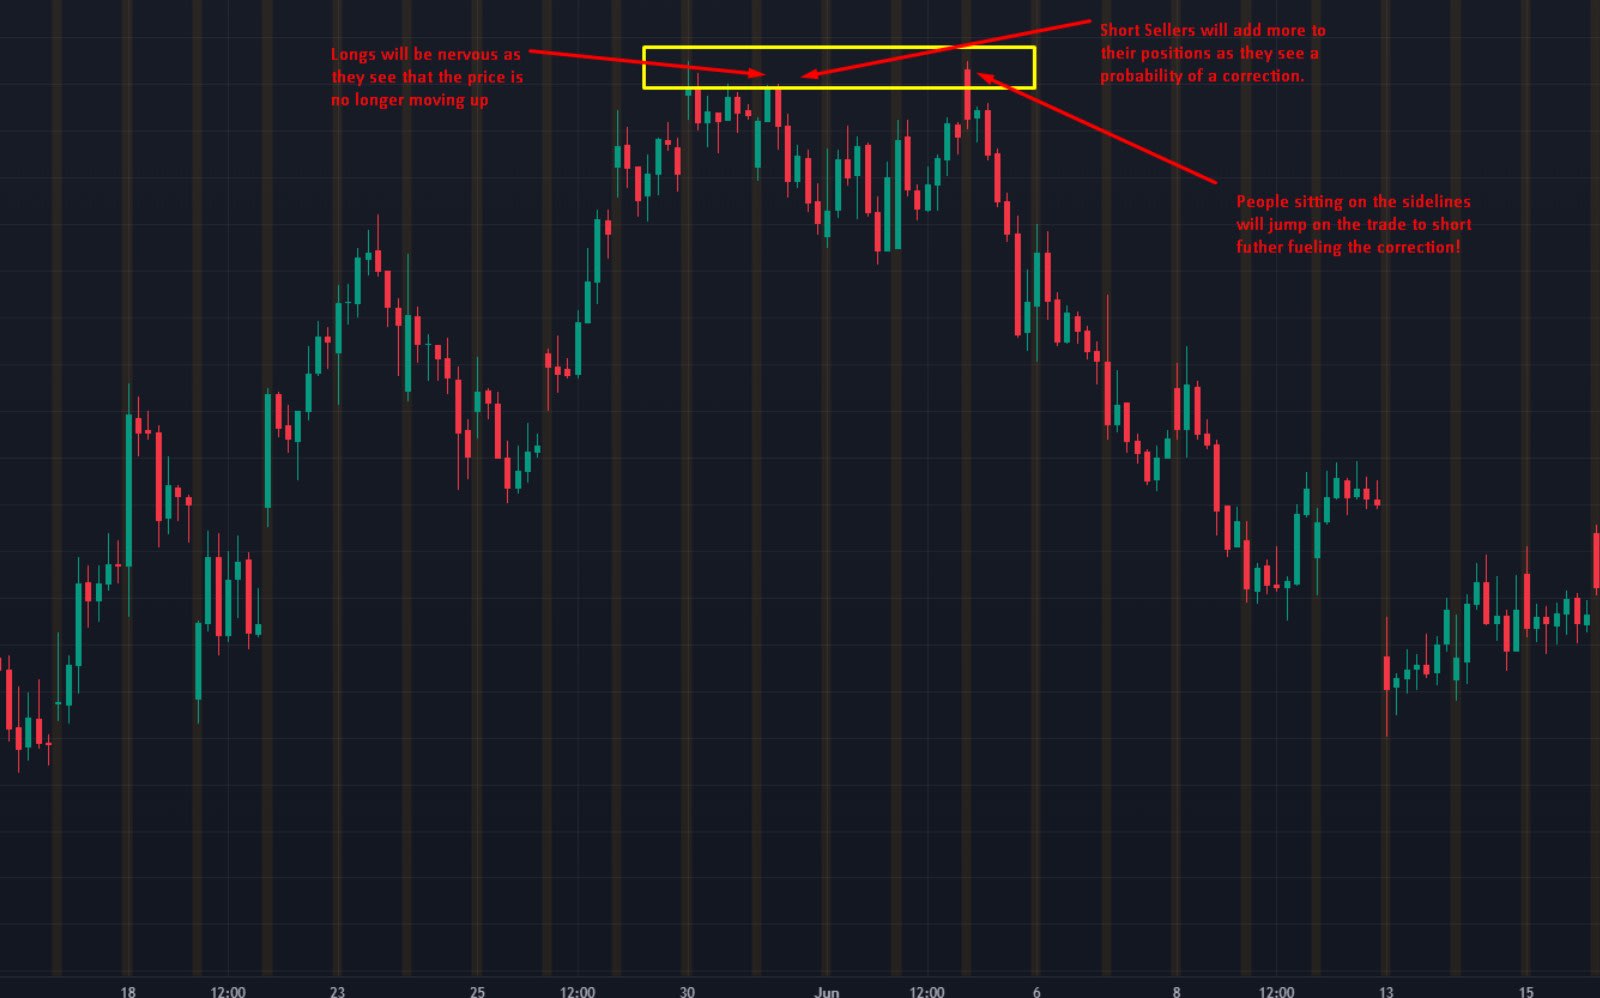
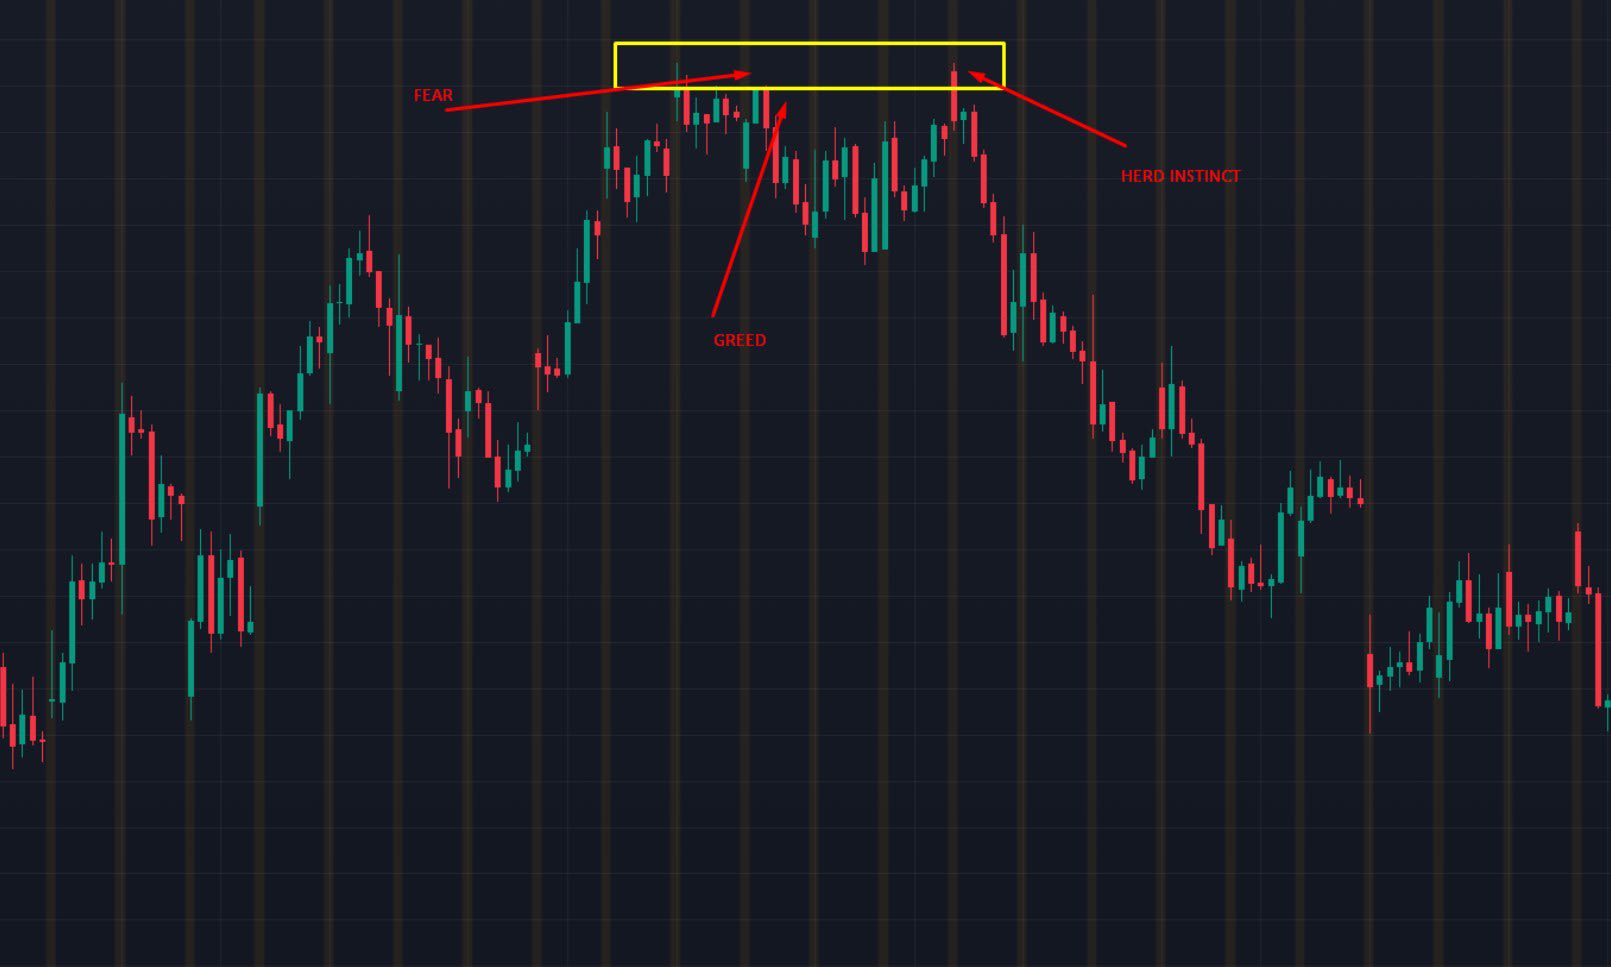
In other words, support and resistance are human behaviour printed on a chart. Three emotions drive it: fear (of losing open profit or of being wrong), greed (adding more at a level that worked before) and herd instinct (following everyone else into the same trade).
How to draw the right levels: 6 traits to look for
Most traders struggle not with the idea of support and resistance but with picking the right area. Their charts end up covered in lines and none of them stand out. Use these anchor points and traits to find the levels that matter.
1. Swing highs and swing lows
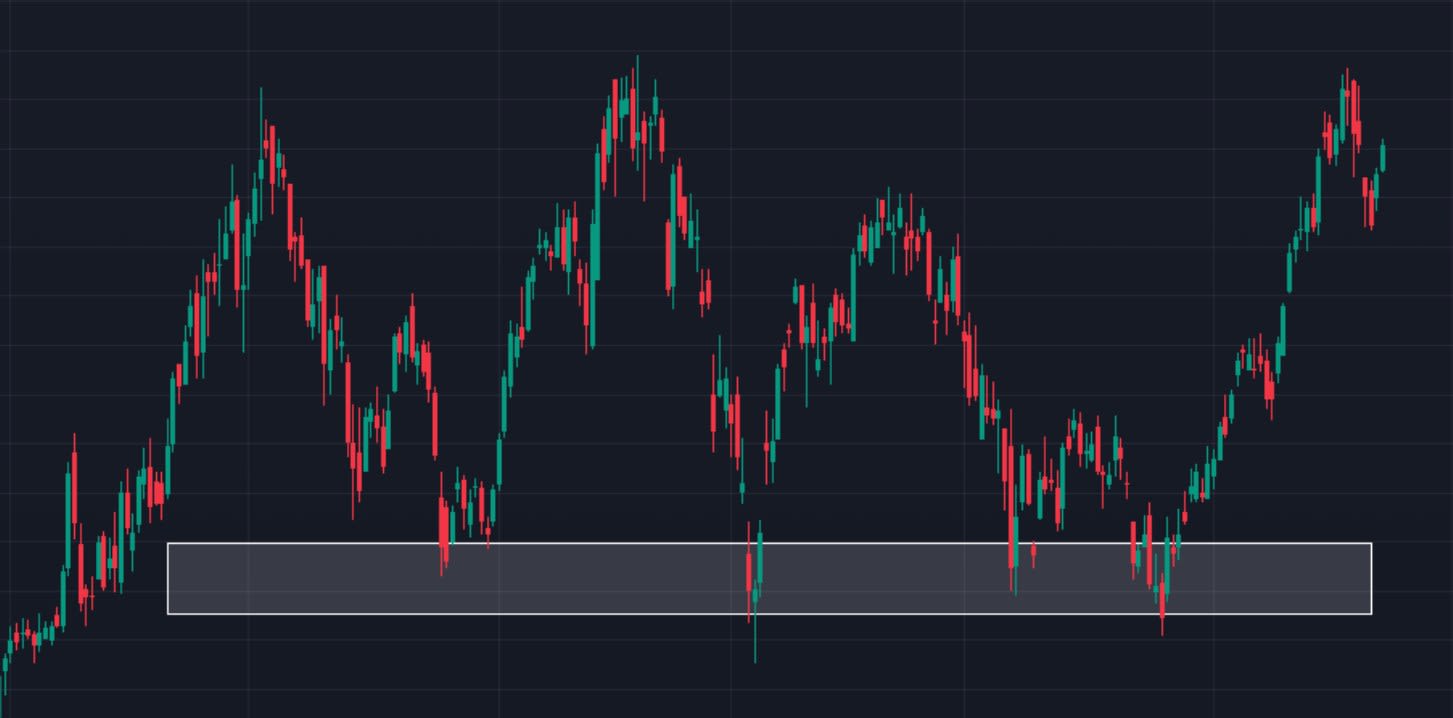
Start with the obvious turning points of a move. A clear swing low that ended a decline is a natural support anchor, and a clear swing high that ended a rally is a natural resistance anchor. Notice how the swing low below later acted as support when price returned.
2. Rejections
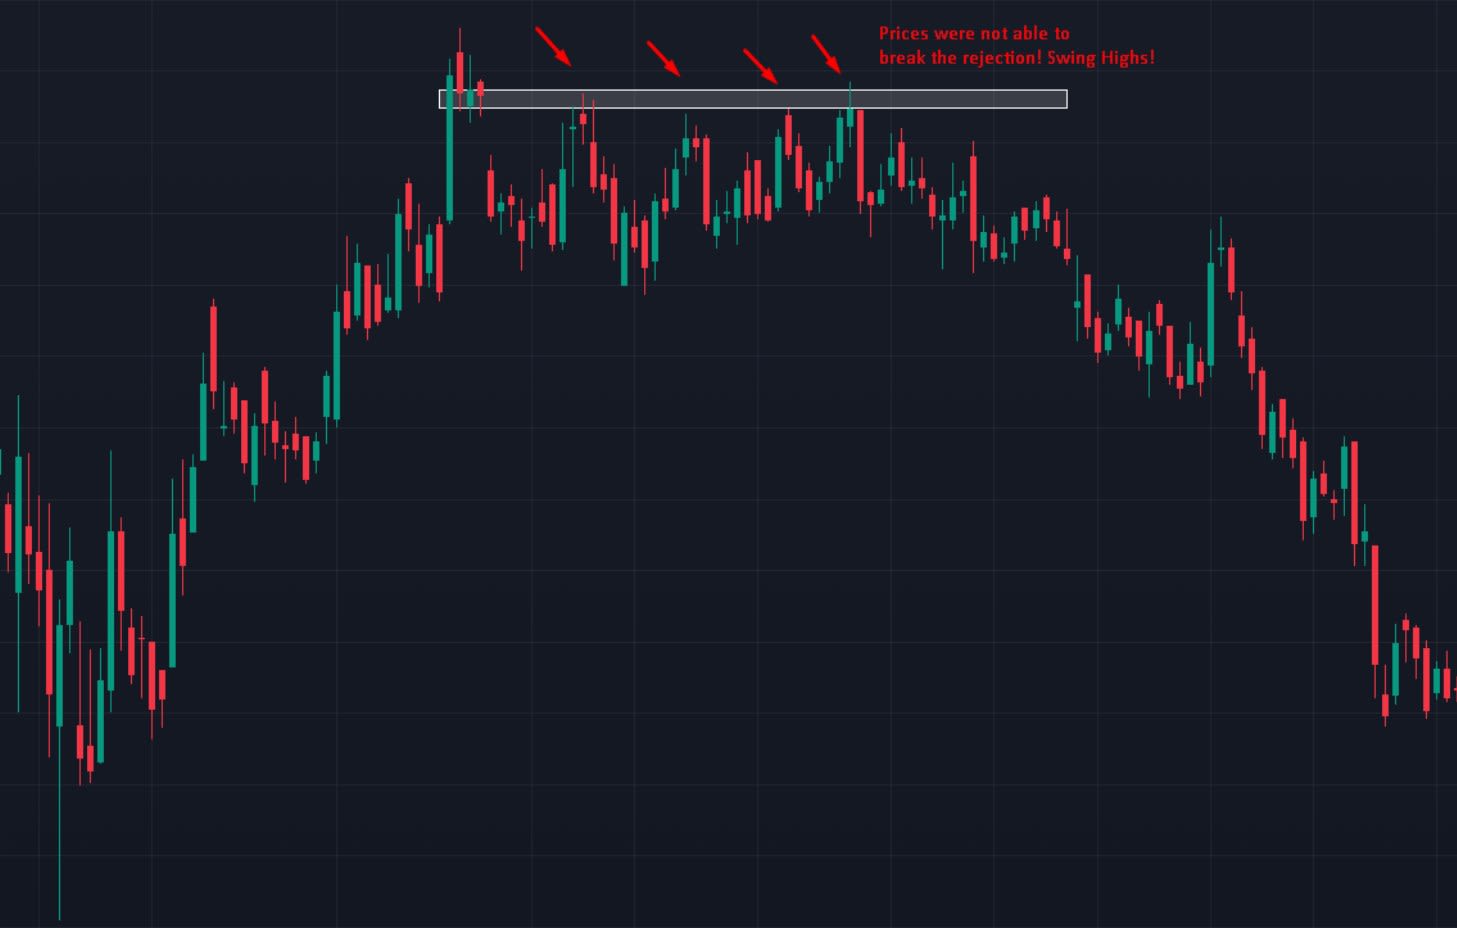
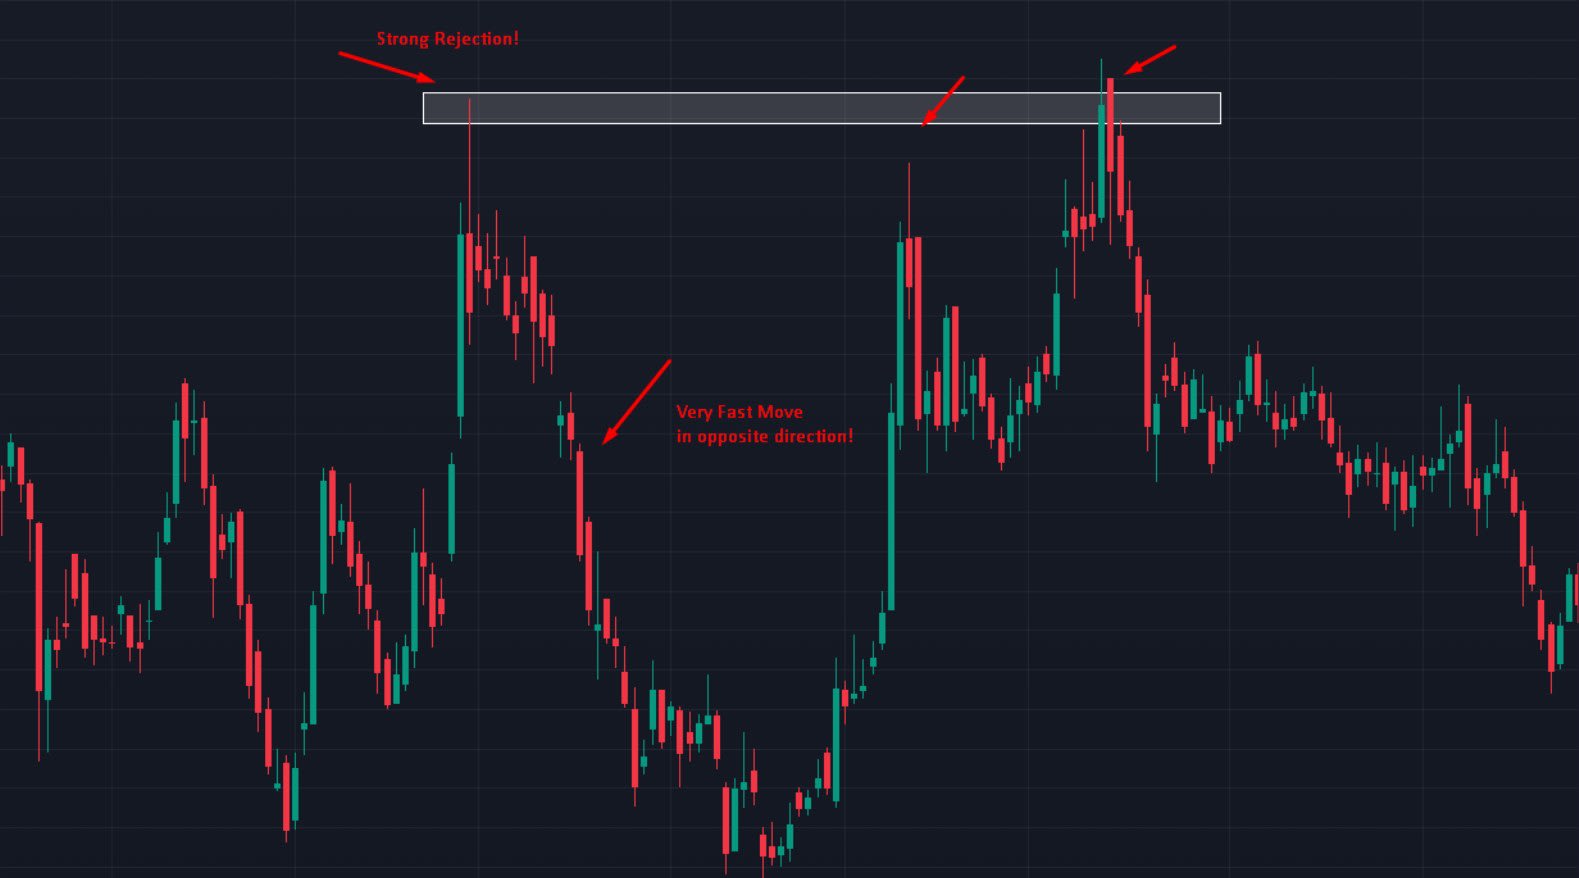
Look for places where price tried to break through and failed, especially more than once. Repeated wicks into the same area show that the other side is defending it.
3. Clutter-free levels
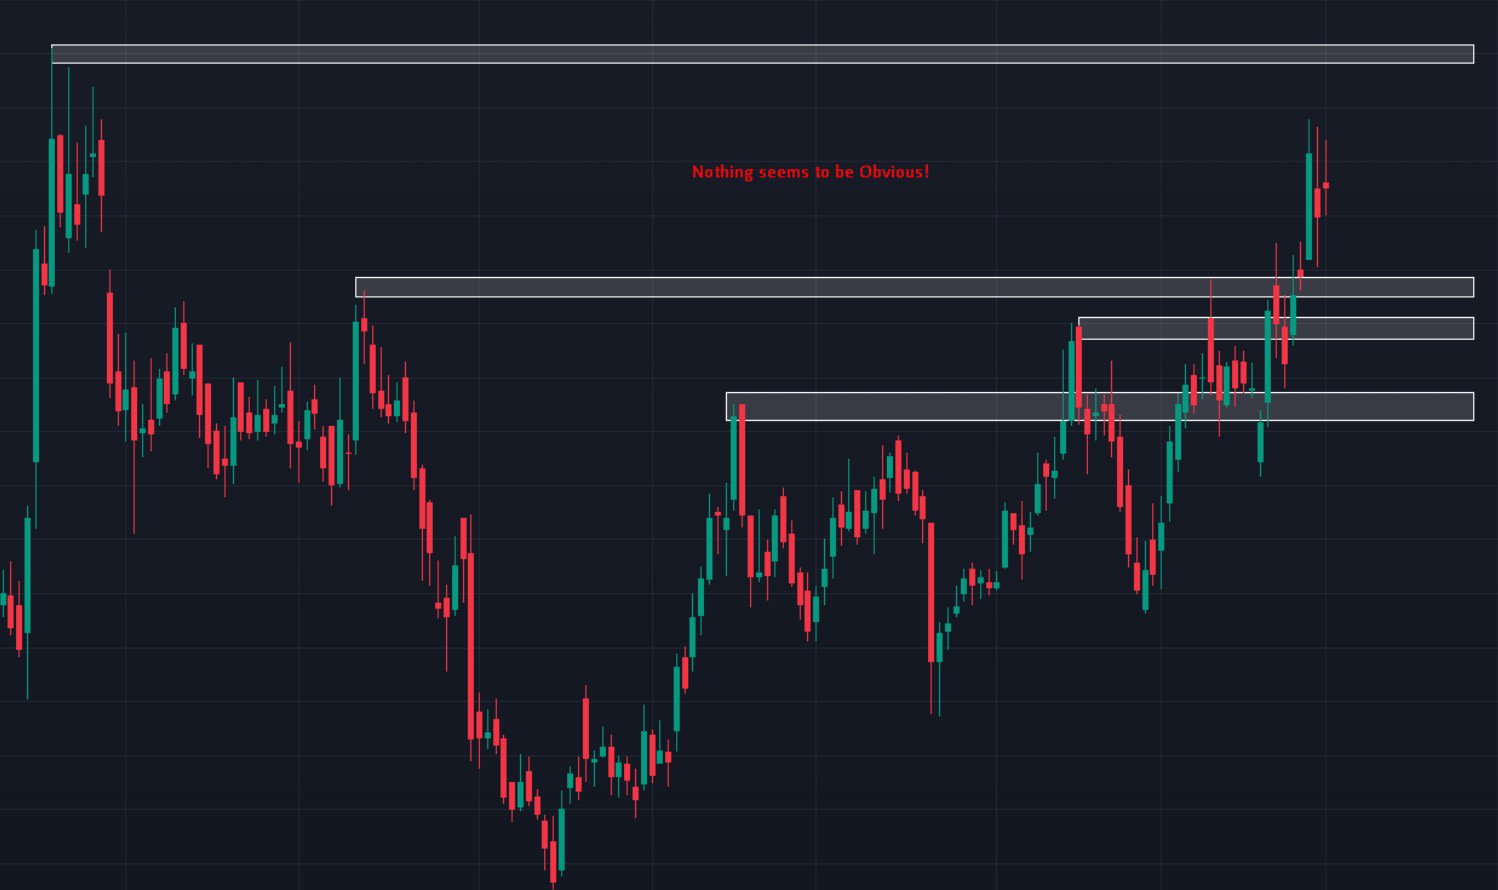
The best levels are pronounced. You should be able to spot them in a second without squinting. A clean zone where price reacted several times is worth far more than a messy area where candles overlap in every direction.
Compare it with the chart below, where several lines have been drawn through choppy price action and nothing is obvious. If you have to argue with yourself about whether a level is real, it probably isn't a strong one.
4. A significant reversal or move away
Pay attention to how price leaves a level. A strong rejection followed by a very fast move in the opposite direction tells you there was a big imbalance of orders there. The faster and further price moved away, the more important the level.
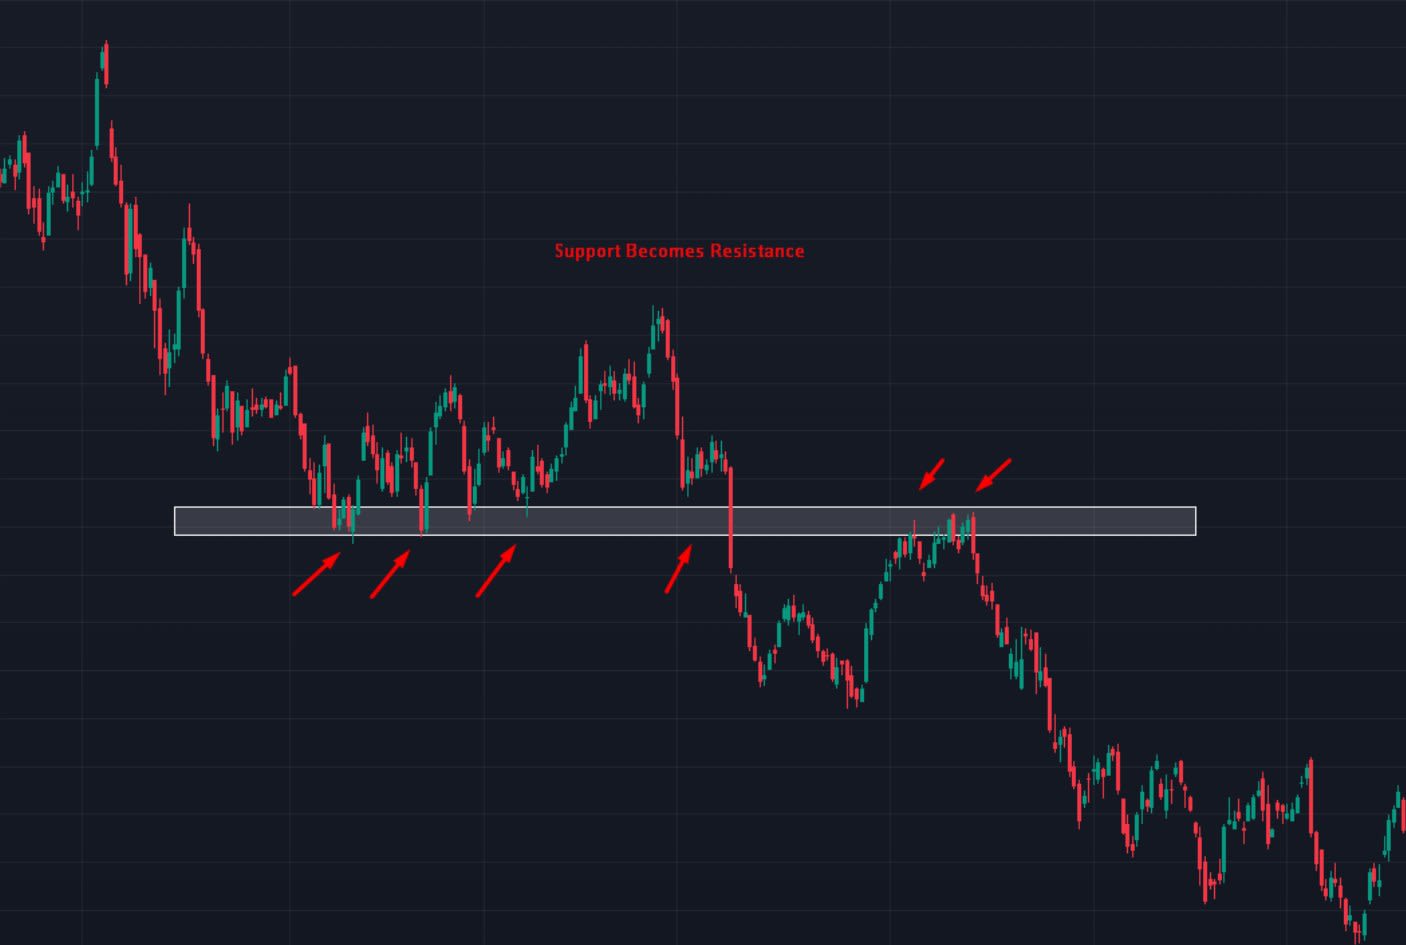
5. Polarity: old resistance becomes support
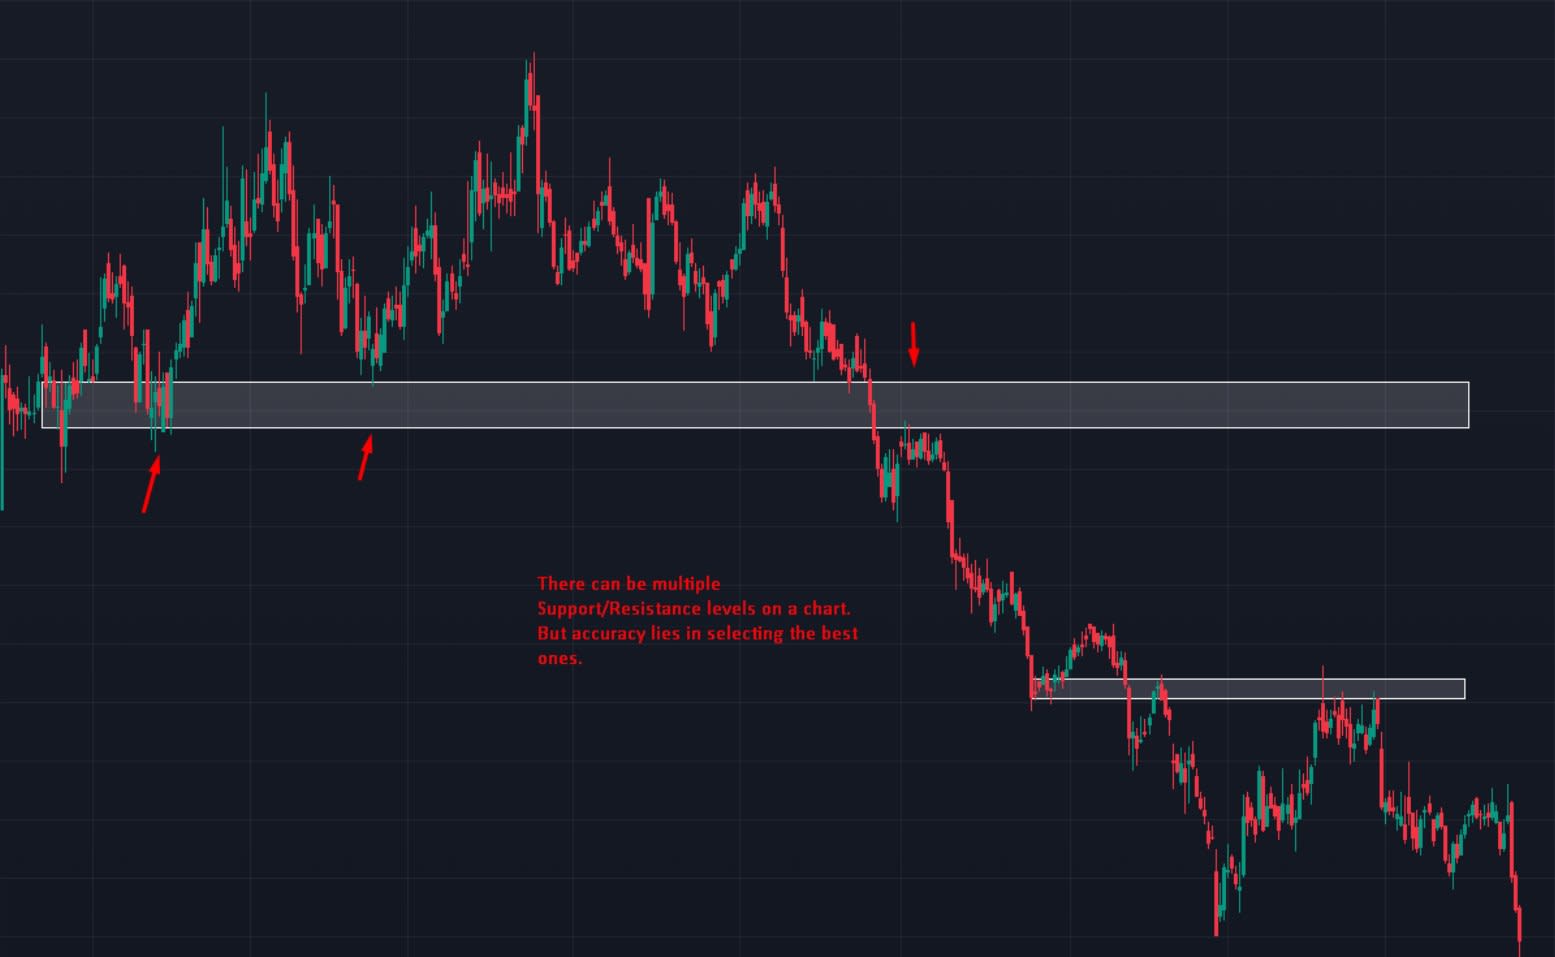
Levels have polarity. Once price breaks above resistance, that same area often becomes support on the retest, because traders who missed the breakout buy there and traders who were short close their losing positions.
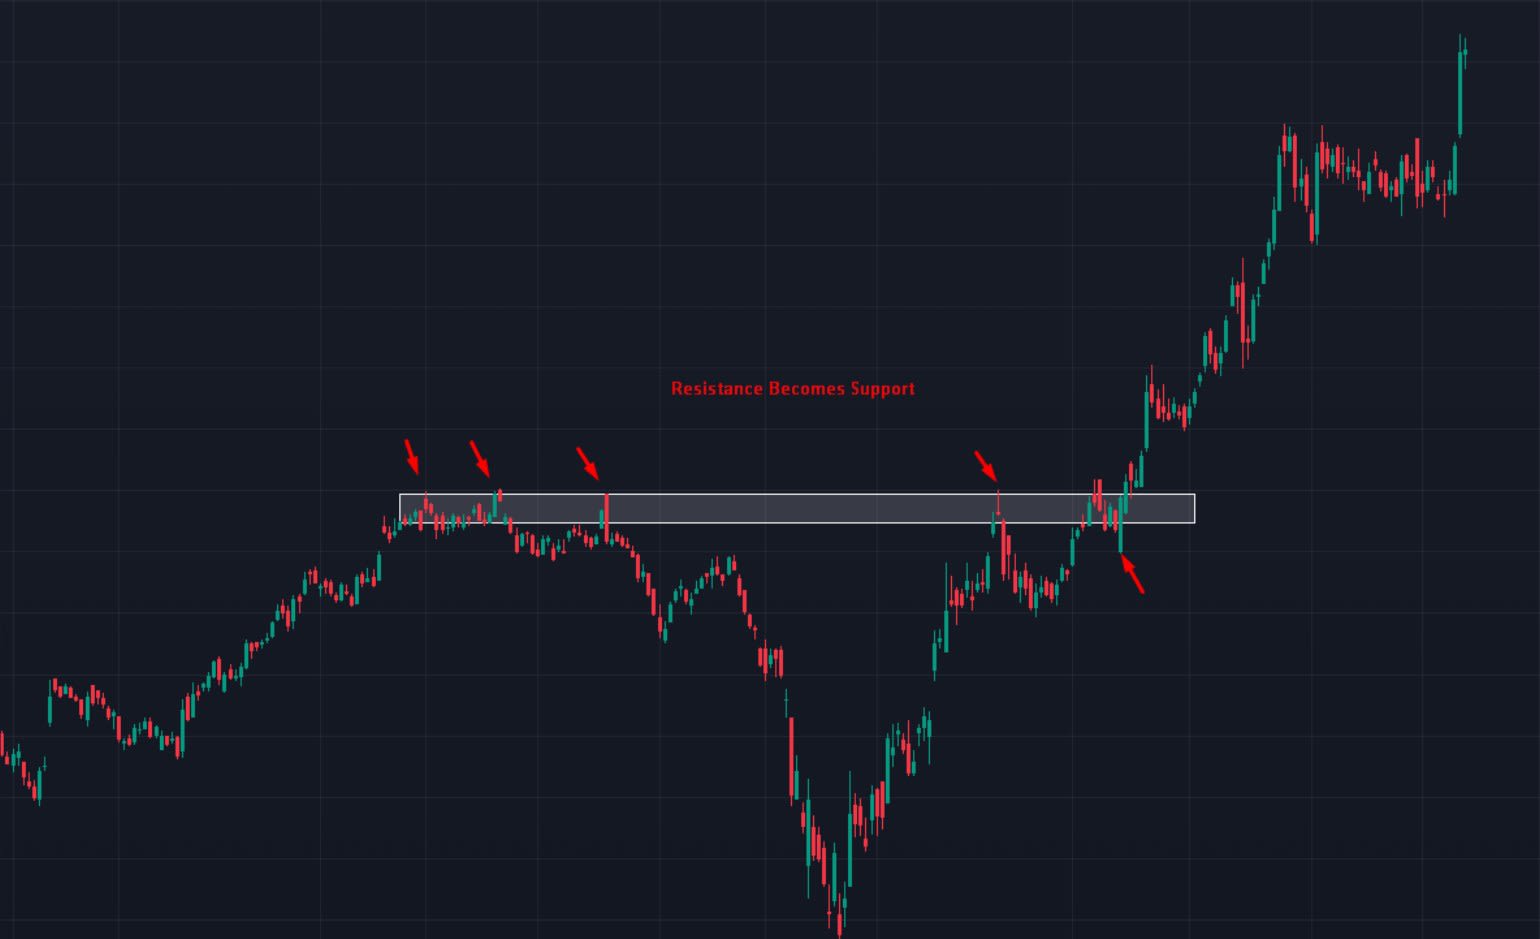
The opposite is just as common. When support breaks, it often becomes resistance on the way back up.
6. Freshly formed levels
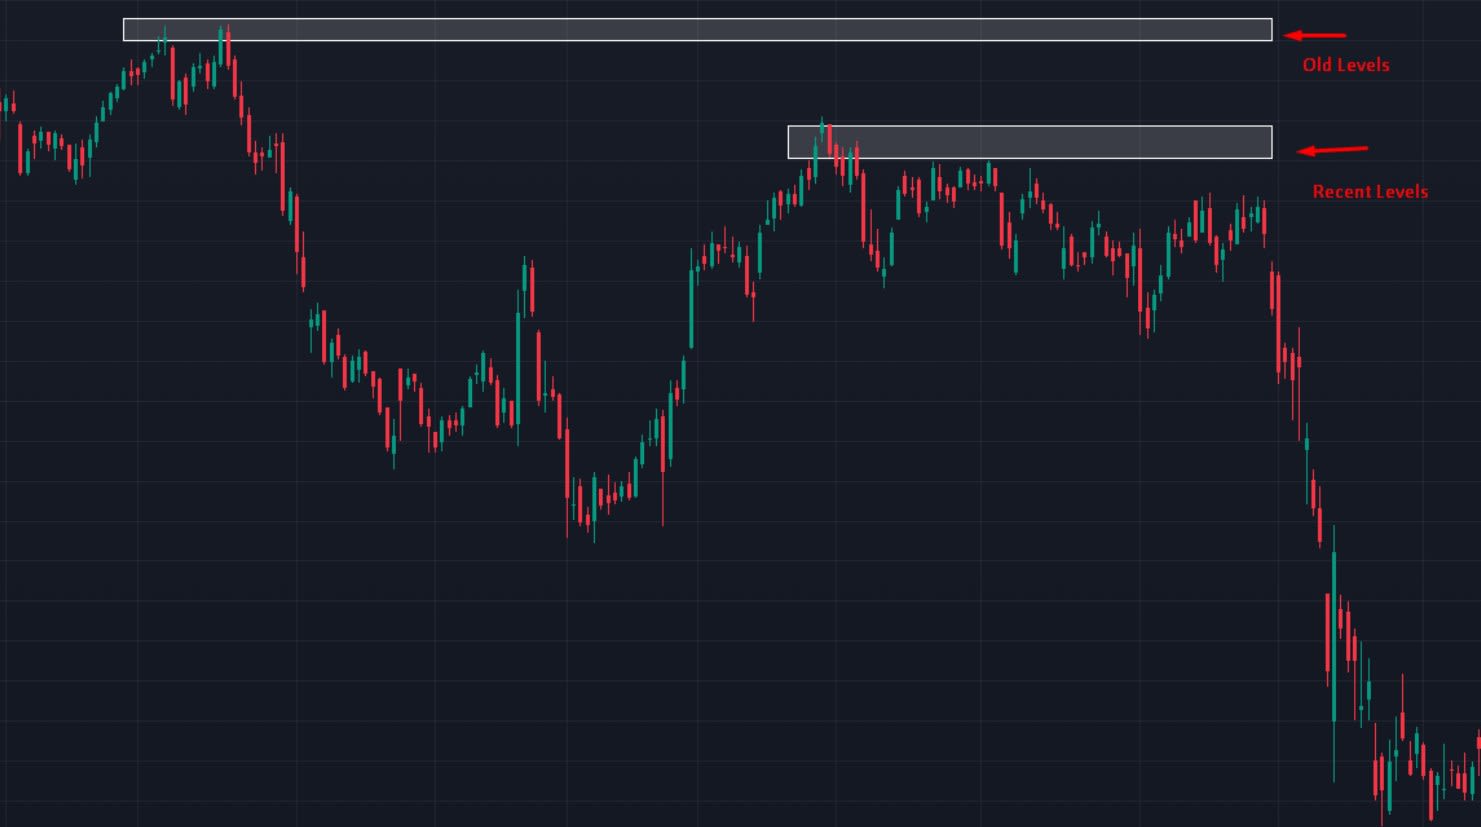
Recent levels usually matter more than old ones. A swing high from last week reflects the current crowd of traders and their open positions, while a level from months ago may no longer have many orders sitting at it.
Which levels are the strongest?
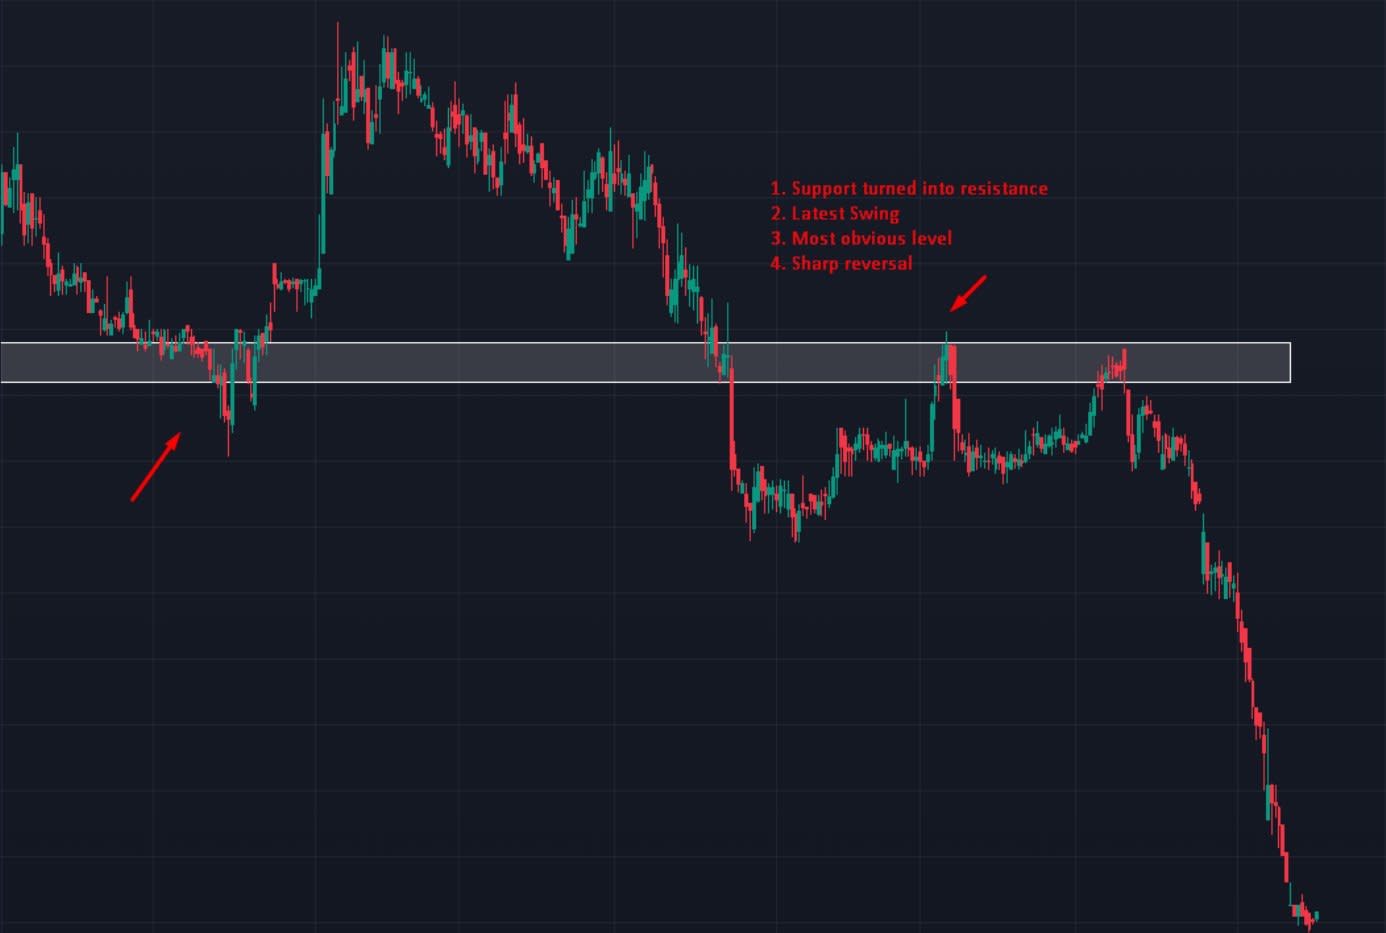
Any one of these traits can make a usable level, but the more traits stack up at the same area, the better it gets. In the example below, the zone was old support that turned into resistance, it was the latest swing, it was the most obvious level on the chart, and price left it with a sharp reversal. Four traits in one place.
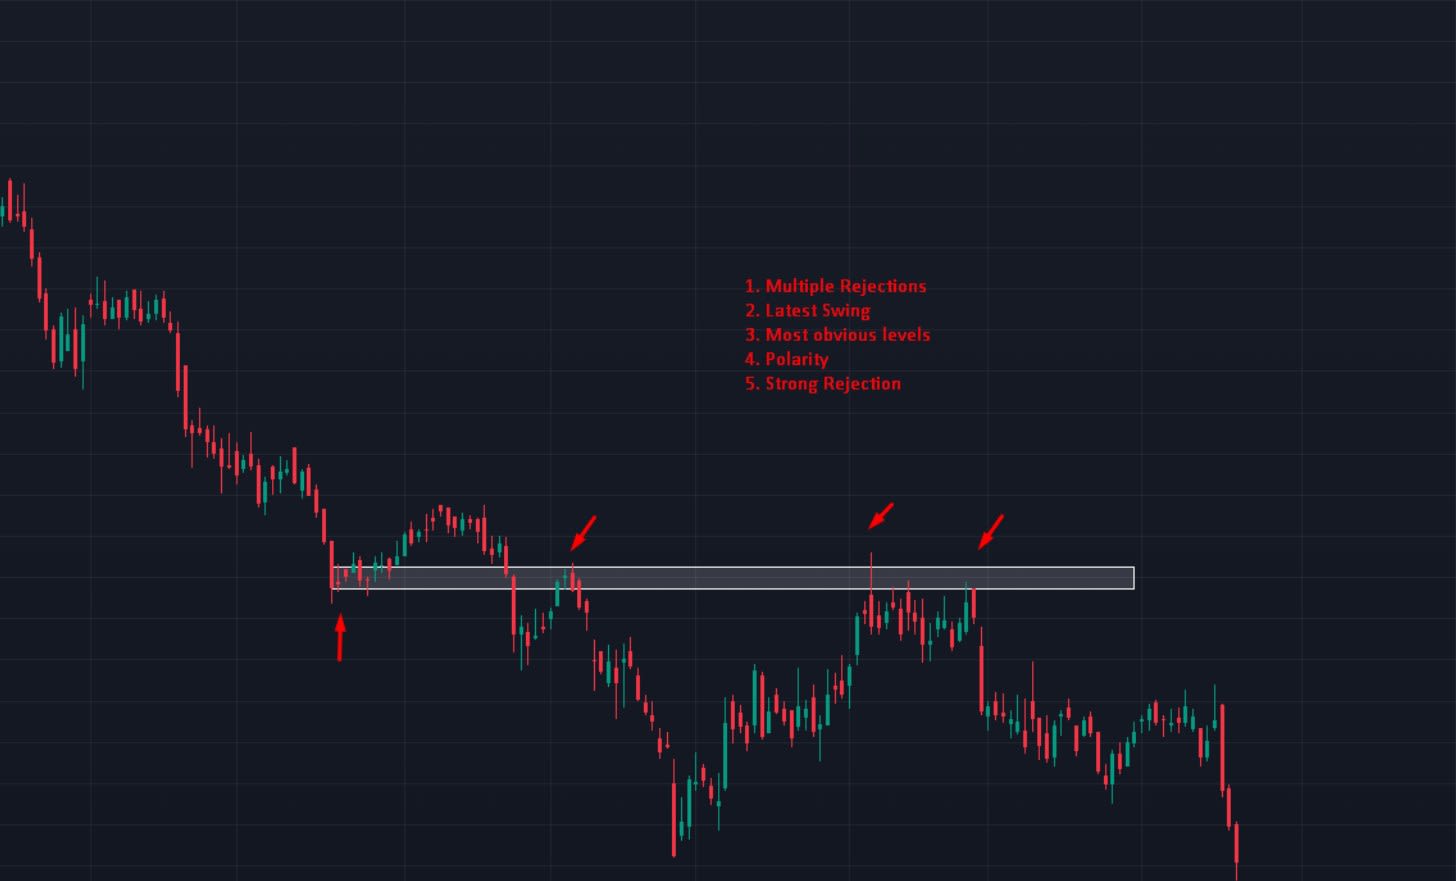
Here, five traits line up: multiple rejections, the latest swing, the most obvious level, polarity and a strong rejection. Zones like this are the ones worth building a trade around.
Quick checklist before you mark a level: Is it a clear swing high or low? Has price rejected it? Is it obvious? Did price leave it fast? Has it flipped from support to resistance or the reverse? Is it recent? The more ticks, the stronger the zone.
Support and resistance are zones, not lines
Price rarely turns at the exact same tick twice. Wicks overshoot, spreads widen and different traders place orders at slightly different prices. Draw support and resistance as a zone, a compact area that covers the wicks and bodies of the touches, rather than a single thin line.
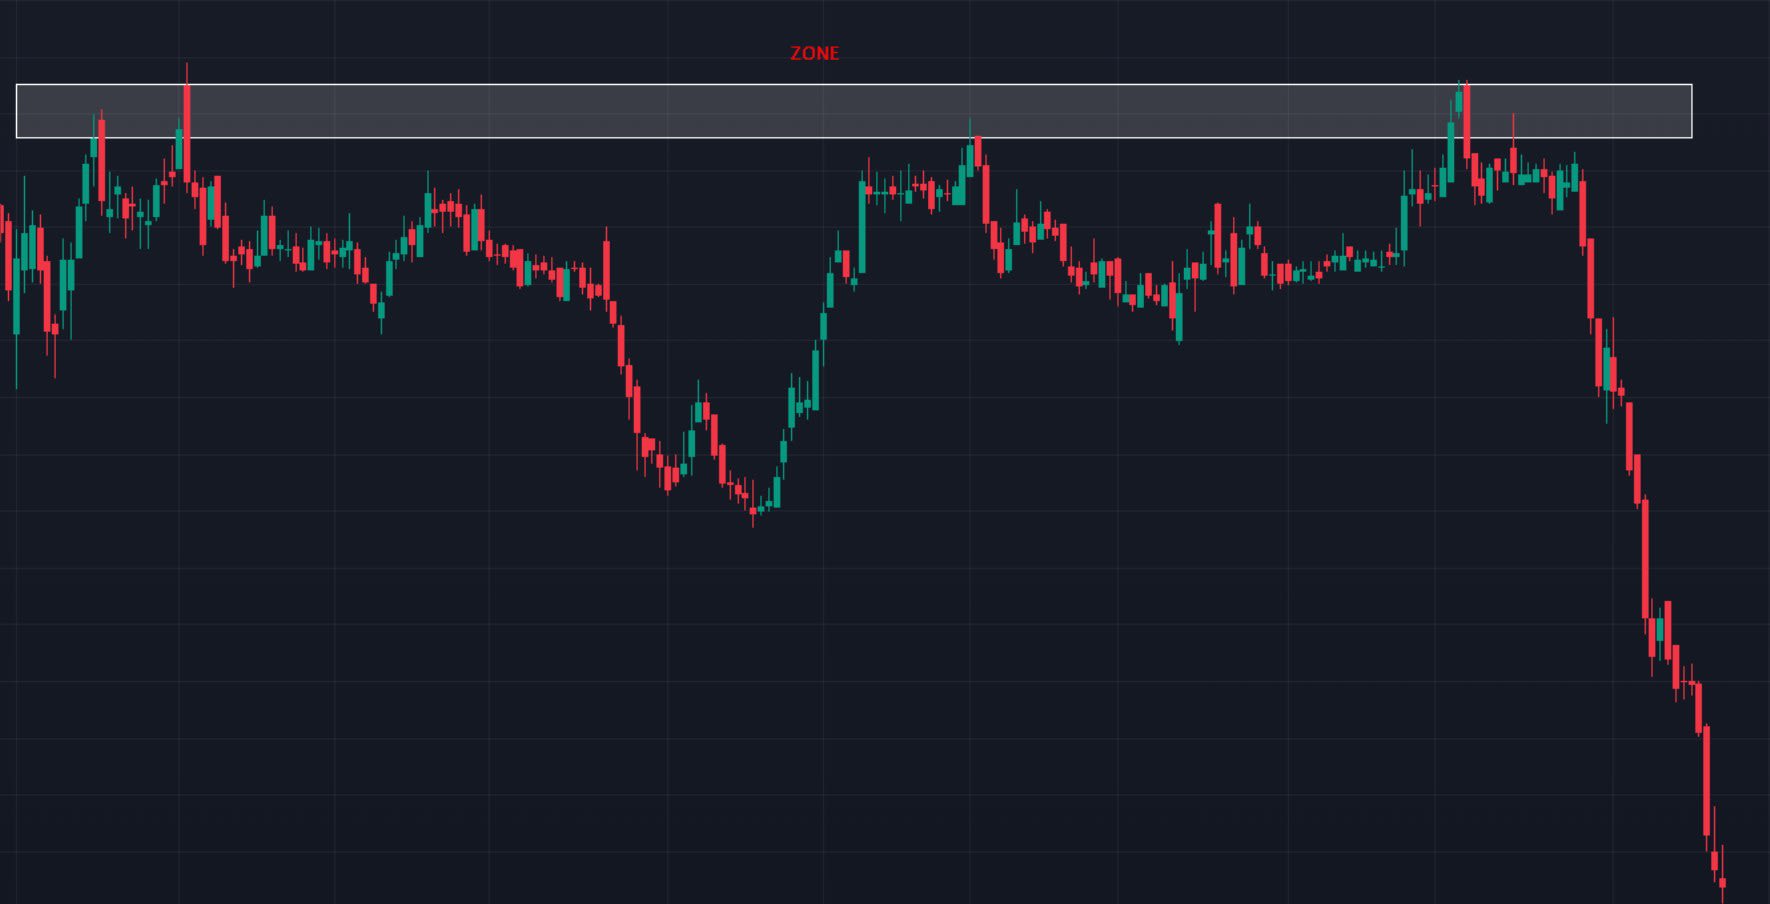
Keep the zone tight. It should be a compact area that captures multiple touch points, not a huge band that covers half the chart. And remember that a chart can have several valid levels at once. Your accuracy comes from picking the best ones, not from drawing all of them.
How to trade support and resistance
Once your zones are marked, there are two main ways to trade them.
The bounce (reversal) trade
- Wait for price to reach the zone. Don't place trades in the middle of nowhere. Let price come to your level.
- Look for confirmation. A rejection wick, an engulfing candle or a lower-timeframe shift in structure shows that buyers (at support) or sellers (at resistance) are stepping in.
- Enter in the direction of the reaction. Buy at support, sell at resistance.
- Put your stop beyond the zone. If price closes cleanly through the zone, your idea is wrong. A stop just beyond the far edge keeps the loss small and logical.
- Target the next opposing level. From support, aim for the next resistance above, and vice versa. Check that the distance gives you a reward-to-risk ratio worth taking.
The break and retest (polarity) trade
- Wait for a decisive break. A strong candle closing through the zone, ideally with momentum behind it.
- Don't chase the breakout. Let price pull back to the zone it just broke.
- Enter on the retest. Old resistance should now hold as support (or old support as resistance). Enter when price reacts there.
- Stop on the other side of the zone. If price falls back into the old range, the breakout has failed.
Common mistakes: drawing too many lines, treating a level as an exact price instead of a zone, entering before price reaches the zone, and ignoring the trend. Support in a strong downtrend breaks far more often than it holds.
Track your support and resistance trades in ETW Journal
The fastest way to find out which levels work for you is to measure it. In ETW Journal, tag every trade with the setup (for example S/R bounce or break and retest) and the traits that were present at the zone. Attach a screenshot of the level you drew. After a few weeks, your analytics will show which setups and which trait combinations actually make money, and you can backtest the same rules in a replay session before risking real capital.
Charts in this guide are from Bharat Jhunjhunwala's (CMT, MFTA) presentation “Understanding Support & Resistance”.