 ETW

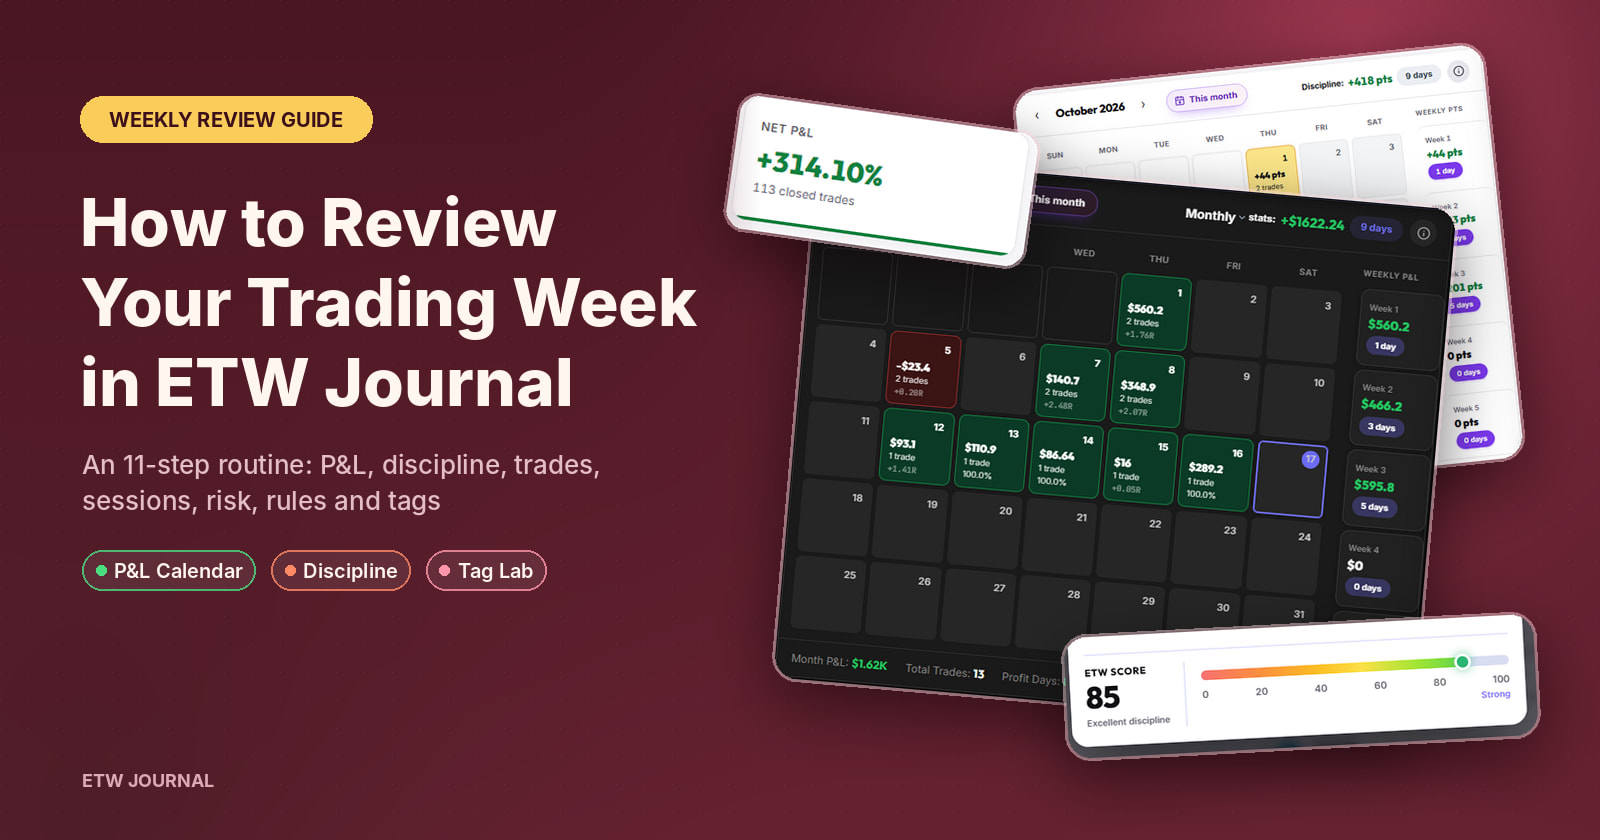
Most traders journal their trades. Far fewer review them. Logging a trade records what happened; a weekly review tells you why it happened and what to do differently next week. That is where the edge is built.
This guide walks you through the exact weekly review routine we use in ETW Journal. It takes about 30–45 minutes, ideally on Saturday or Sunday when the markets are closed. To keep it practical, every step uses a real week from a live account: Monday 12 to Friday 16 October 2026, five trades, five winners and +$595.80.
You'll see that even a perfect-looking green week has lessons hidden inside it.
What you'll need: ETW Journal with your trades synced or added, the week's trades tagged, and a quiet 30–45 minutes. A notebook (or ETW's daily notes) for your answers helps too.
Why a weekly review beats a daily one
A single day is too small to judge. One trade can make or ruin it, and emotions are still fresh. A month is too long: by the time you spot a bad habit, it has already cost you. A week is the sweet spot:
- Enough data to see patterns across days, sessions and setups.
- Short enough to fix a problem before it compounds.
- Calm distance from each trade, so you judge decisions, not outcomes.
- A natural rhythm: review on the weekend, plan the next week, then execute.
The goal of every review is to answer three questions: What worked? What didn't? What will I do differently next week? The 11 steps below help you answer them with data instead of feelings.
Step 1: Filter your Reports to the week
Start in Reports. Before looking at a single number, set the scope so every chart and table only shows the week you're reviewing.
- Open Reports and choose the account you traded (here, Pepperstone Live 1).
- Set Date from to Monday and Date to to Friday (10/12/2026 to 10/16/2026).
- Leave Instrument, Direction, Result, Strategy and Session on All for now.
- Click Apply Filters.
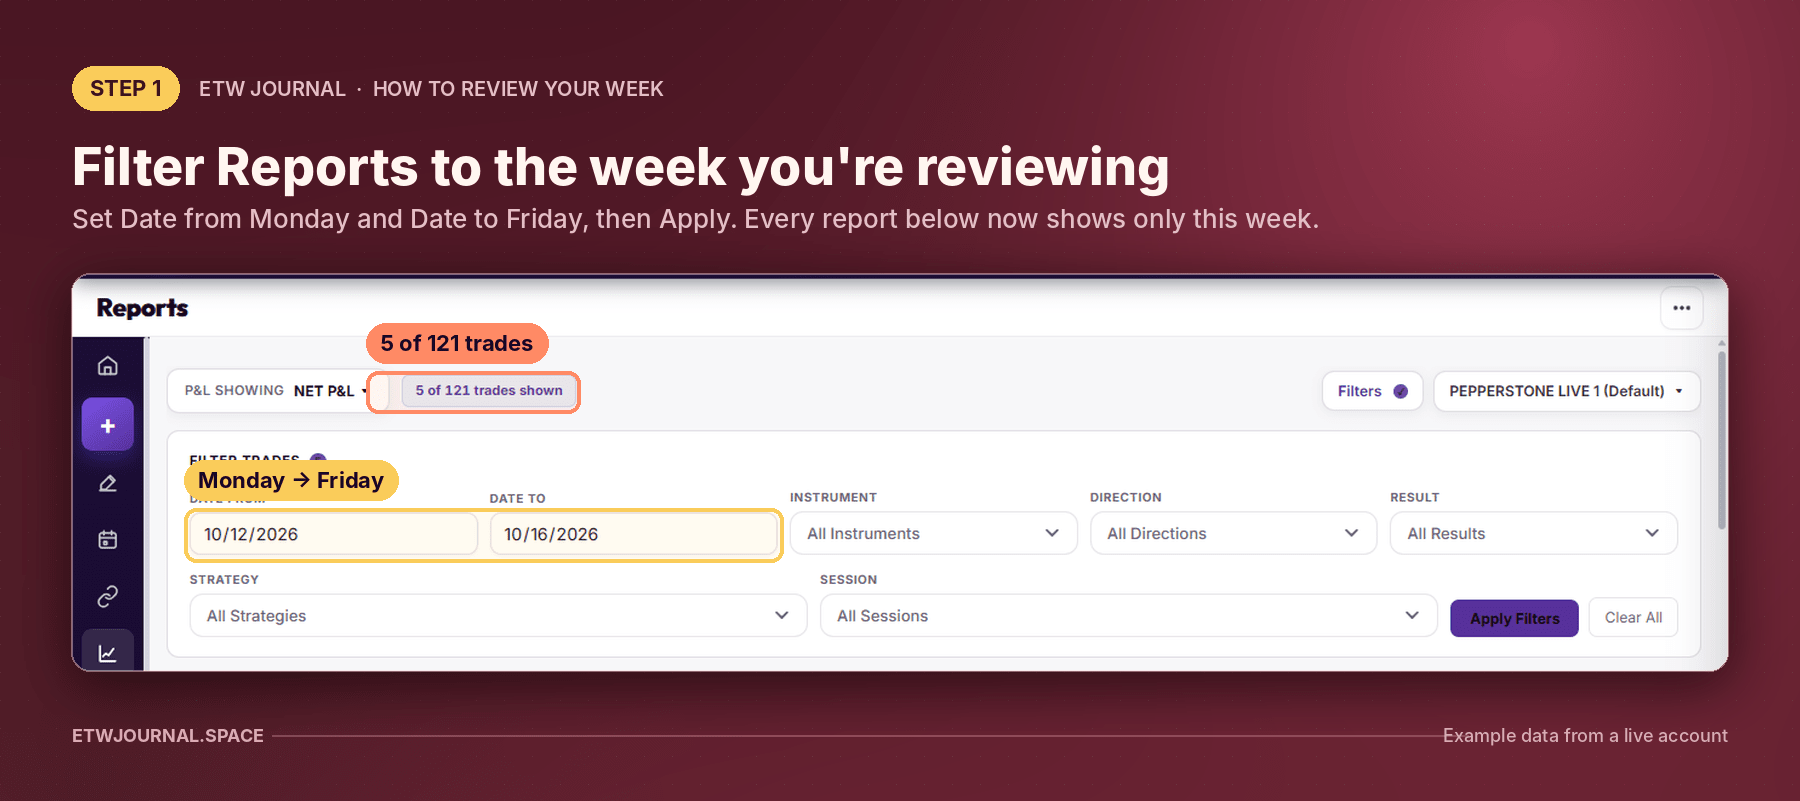
The badge at the top now reads 5 of 121 trades shown. That's your sanity check: if the count doesn't match what you remember trading, a trade is missing or wasn't synced. Fix that first, because every insight below depends on complete data.
Tip: Later in the review, come back to these filters and narrow them down, for example only Shorts or only the London session, to test an idea you've spotted.
Step 2: Get the big picture from the P&L Calendar
The P&L Calendar gives you the whole week in one glance. Each day shows its P&L, number of trades and R multiple, and the Weekly P&L column on the right totals each week.
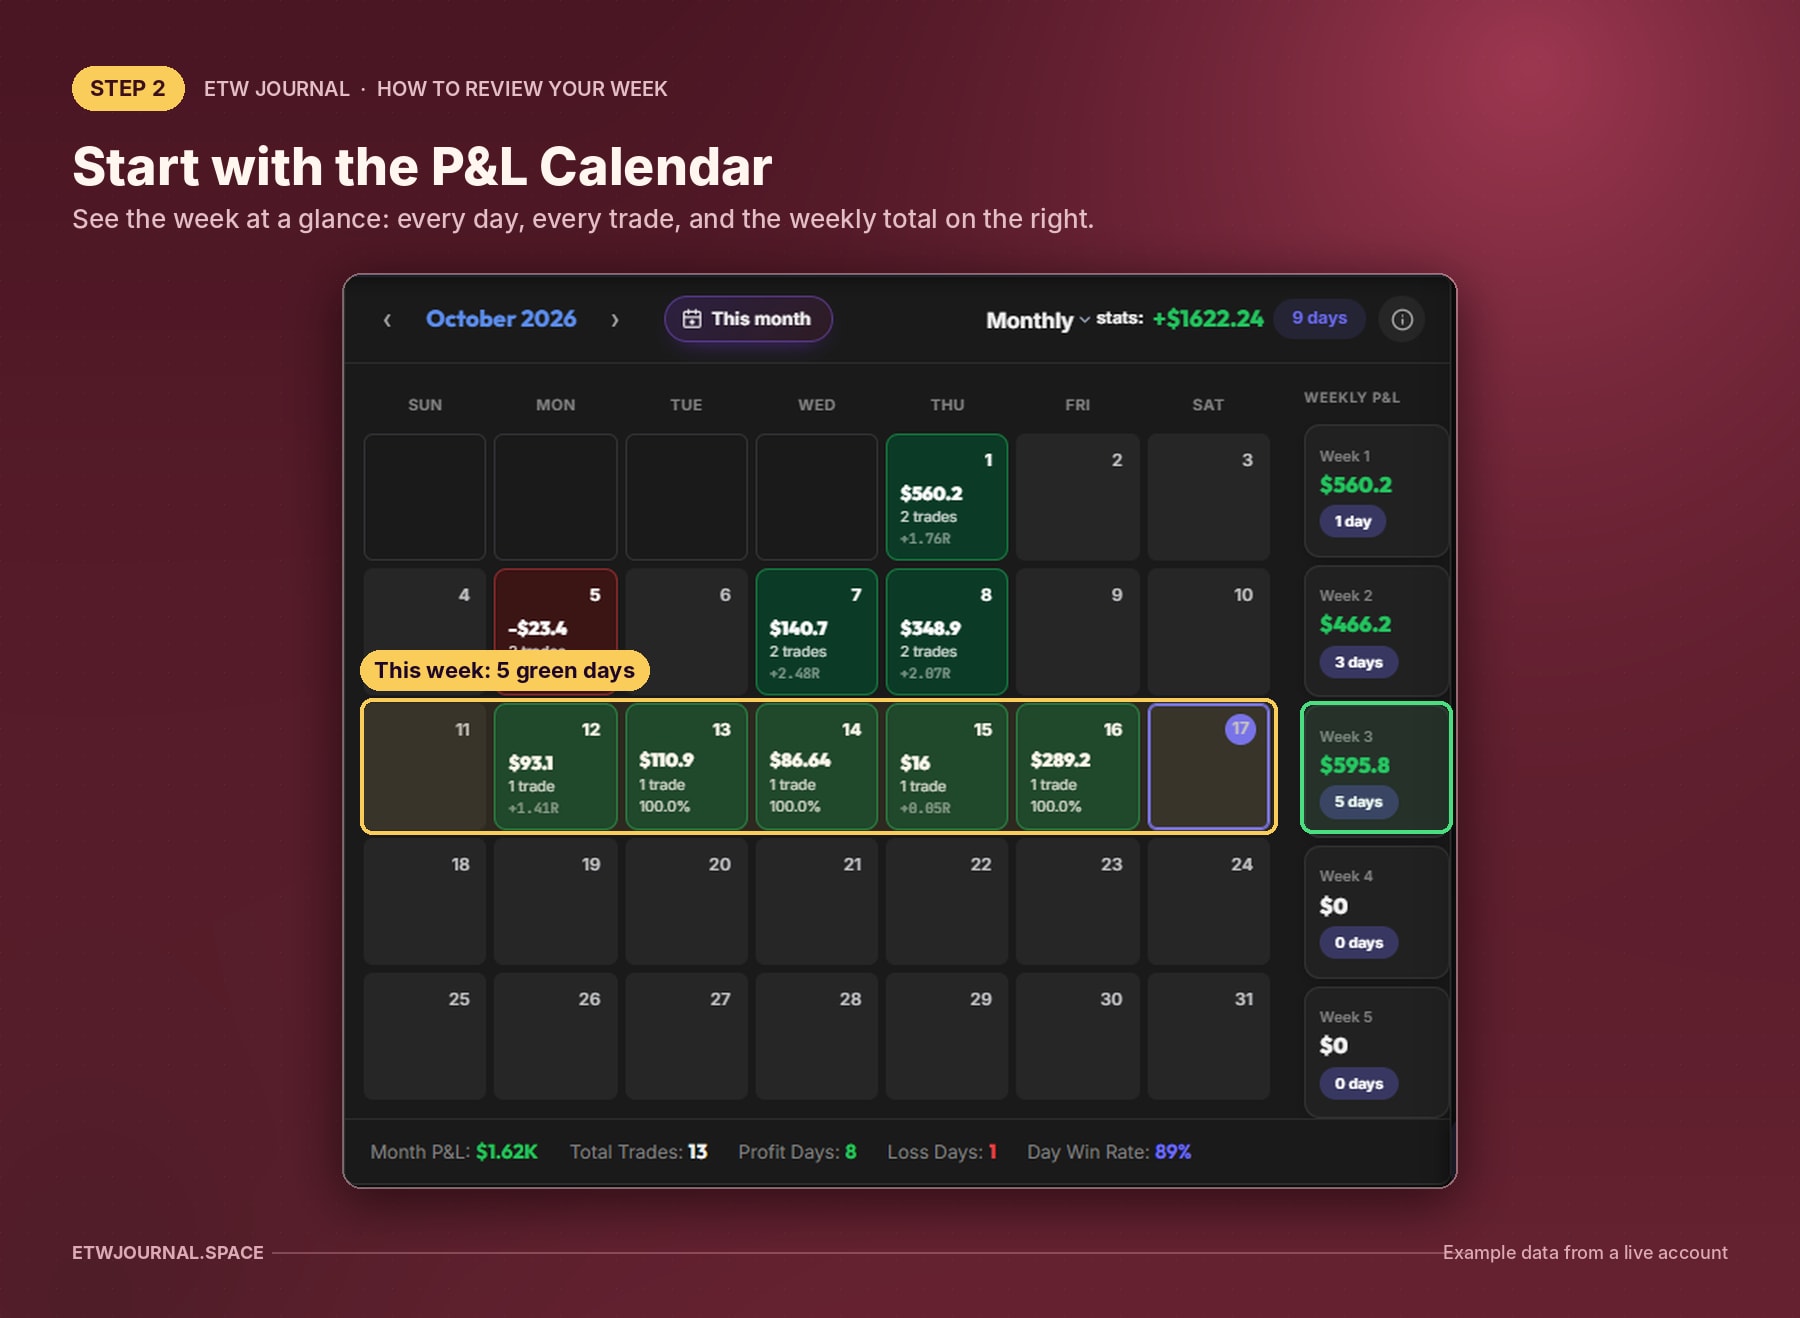
For our example week:
- Mon 12: +$93.10, 1 trade, +1.41R
- Tue 13: +$110.90, 1 trade
- Wed 14: +$86.64, 1 trade
- Thu 15: +$16.00, 1 trade, +0.05R
- Fri 16: +$289.20, 1 trade
Week 3 total: +$595.80 over 5 days. The footer adds month-to-date context: $1.62K P&L, 13 trades, 8 profit days, 1 loss day and an 89% day win rate.
Questions to ask yourself
- How many trades did I take each day? Did I stick to my maximum?
- Was one day responsible for most of the profit? (Here, Friday made almost half the week.)
- Are there tiny wins like Thursday's +0.05R? Small R usually means an early exit or a weak setup. Flag it for Step 4.
- How does this week compare with weeks 1 and 2?
Step 3: Check your discipline, not just your profit
A green day isn't automatically a good day. The Discipline Calendar scores your process in discipline points: session prep, checklists, stop losses, journaling, risk and how selective you were. Read more in our Discipline PnL Calendar guide.
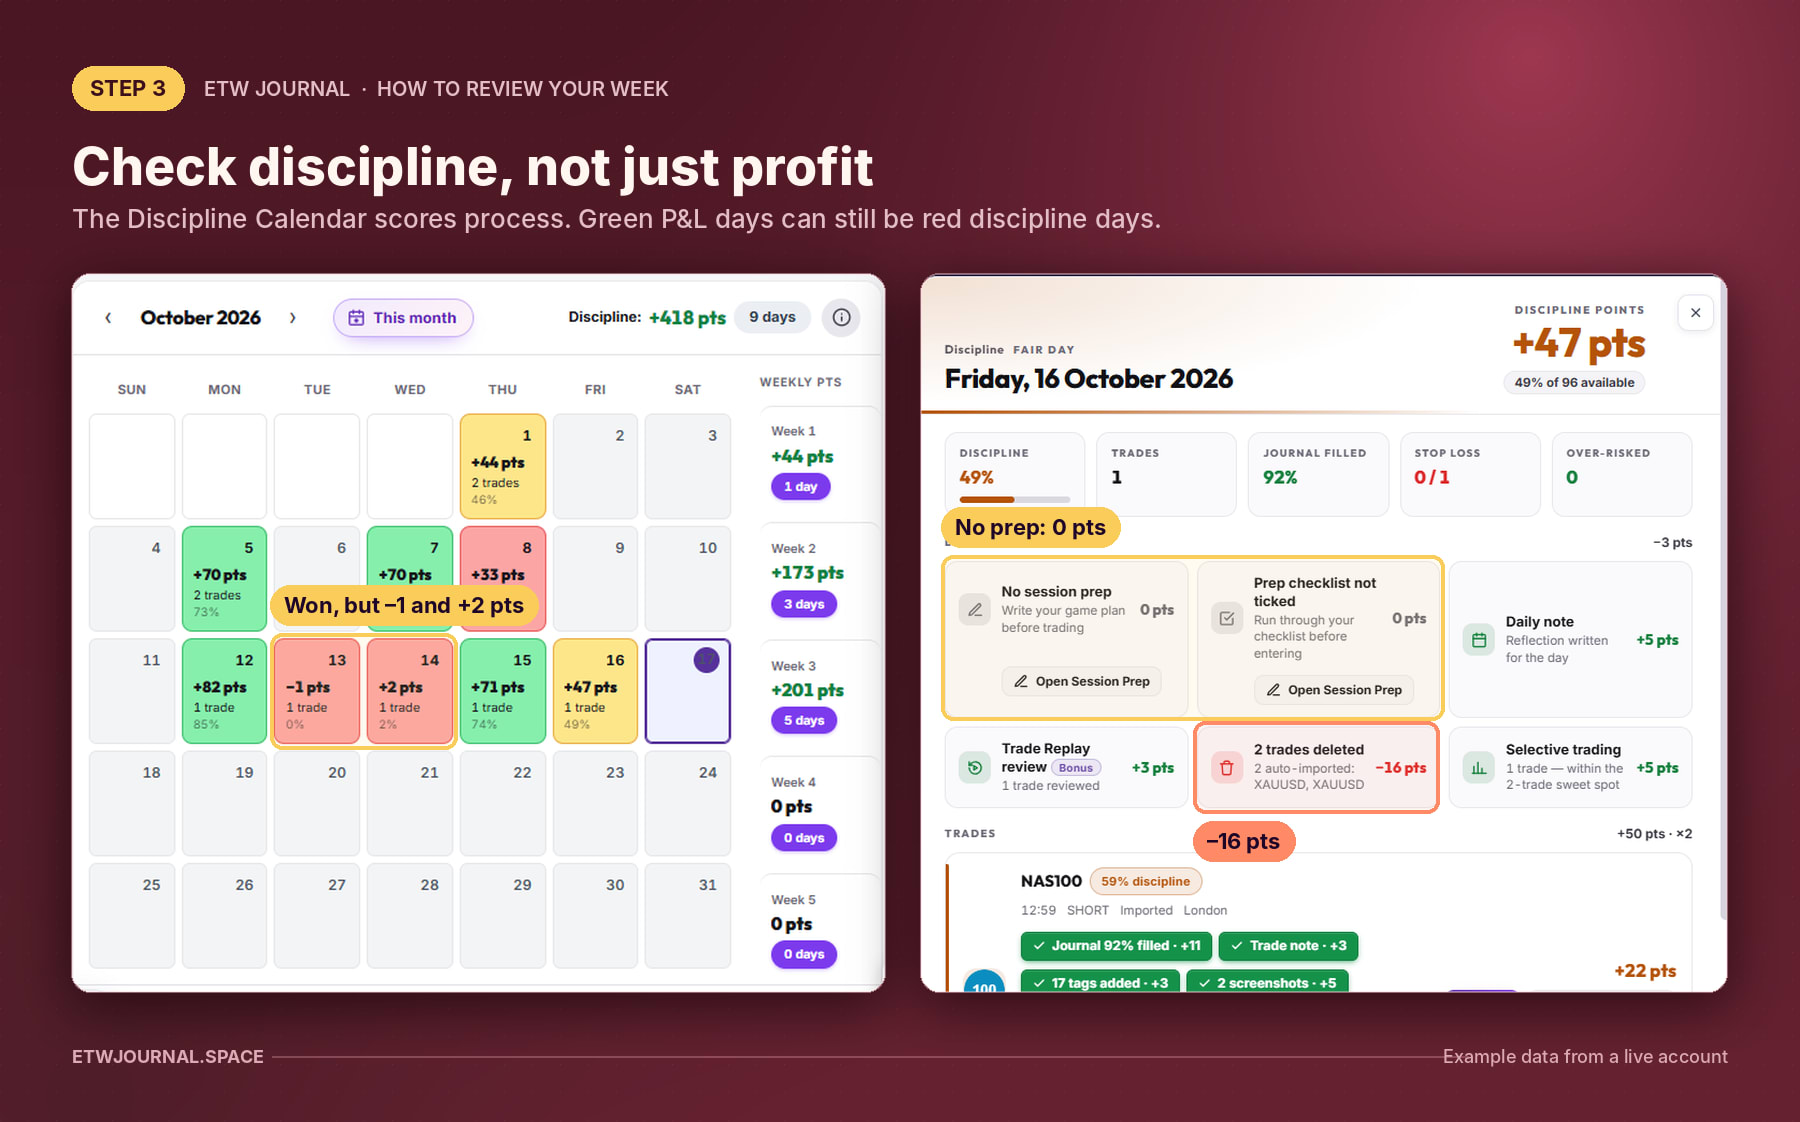
Put the two calendars side by side and the story changes:
- Mon 12: +82 pts (85%), a disciplined winner.
- Tue 13: −1 pt (0%) even though the trade made +$110.90.
- Wed 14: +2 pts (2%) even though the trade made +$86.64.
- Thu 15: +71 pts (74%).
- Fri 16: +47 pts (49%), a "fair" day.
Week 3 still scored +201 pts, but two of the five wins came from poor process. Those are the most dangerous trades in your journal: they reward bad habits, and bad habits eventually cost money.
Click into a day to see why
Click any day for the full breakdown. On Friday 16 October, the trade won +$289.20, yet discipline was only 49%:
- No session prep and prep checklist not ticked: 0 pts each.
- 2 trades deleted (two auto-imported XAUUSD trades): −16 pts.
- Stop loss 0/1: the trade had no stop loss recorded.
- Positives: daily note (+5), Trade Replay review (+3) and selective trading with just 1 trade (+5). The journal was 92% filled.
Lesson: The biggest win of the week came on a day with no prep and no recorded stop. Next week's first goal is simple: complete Session Prep before every session and always set a stop.
Step 4: Review every trade, one by one
Now open the trade list and go through each trade from the week. Look at the instrument, side, setup, session, result and R.
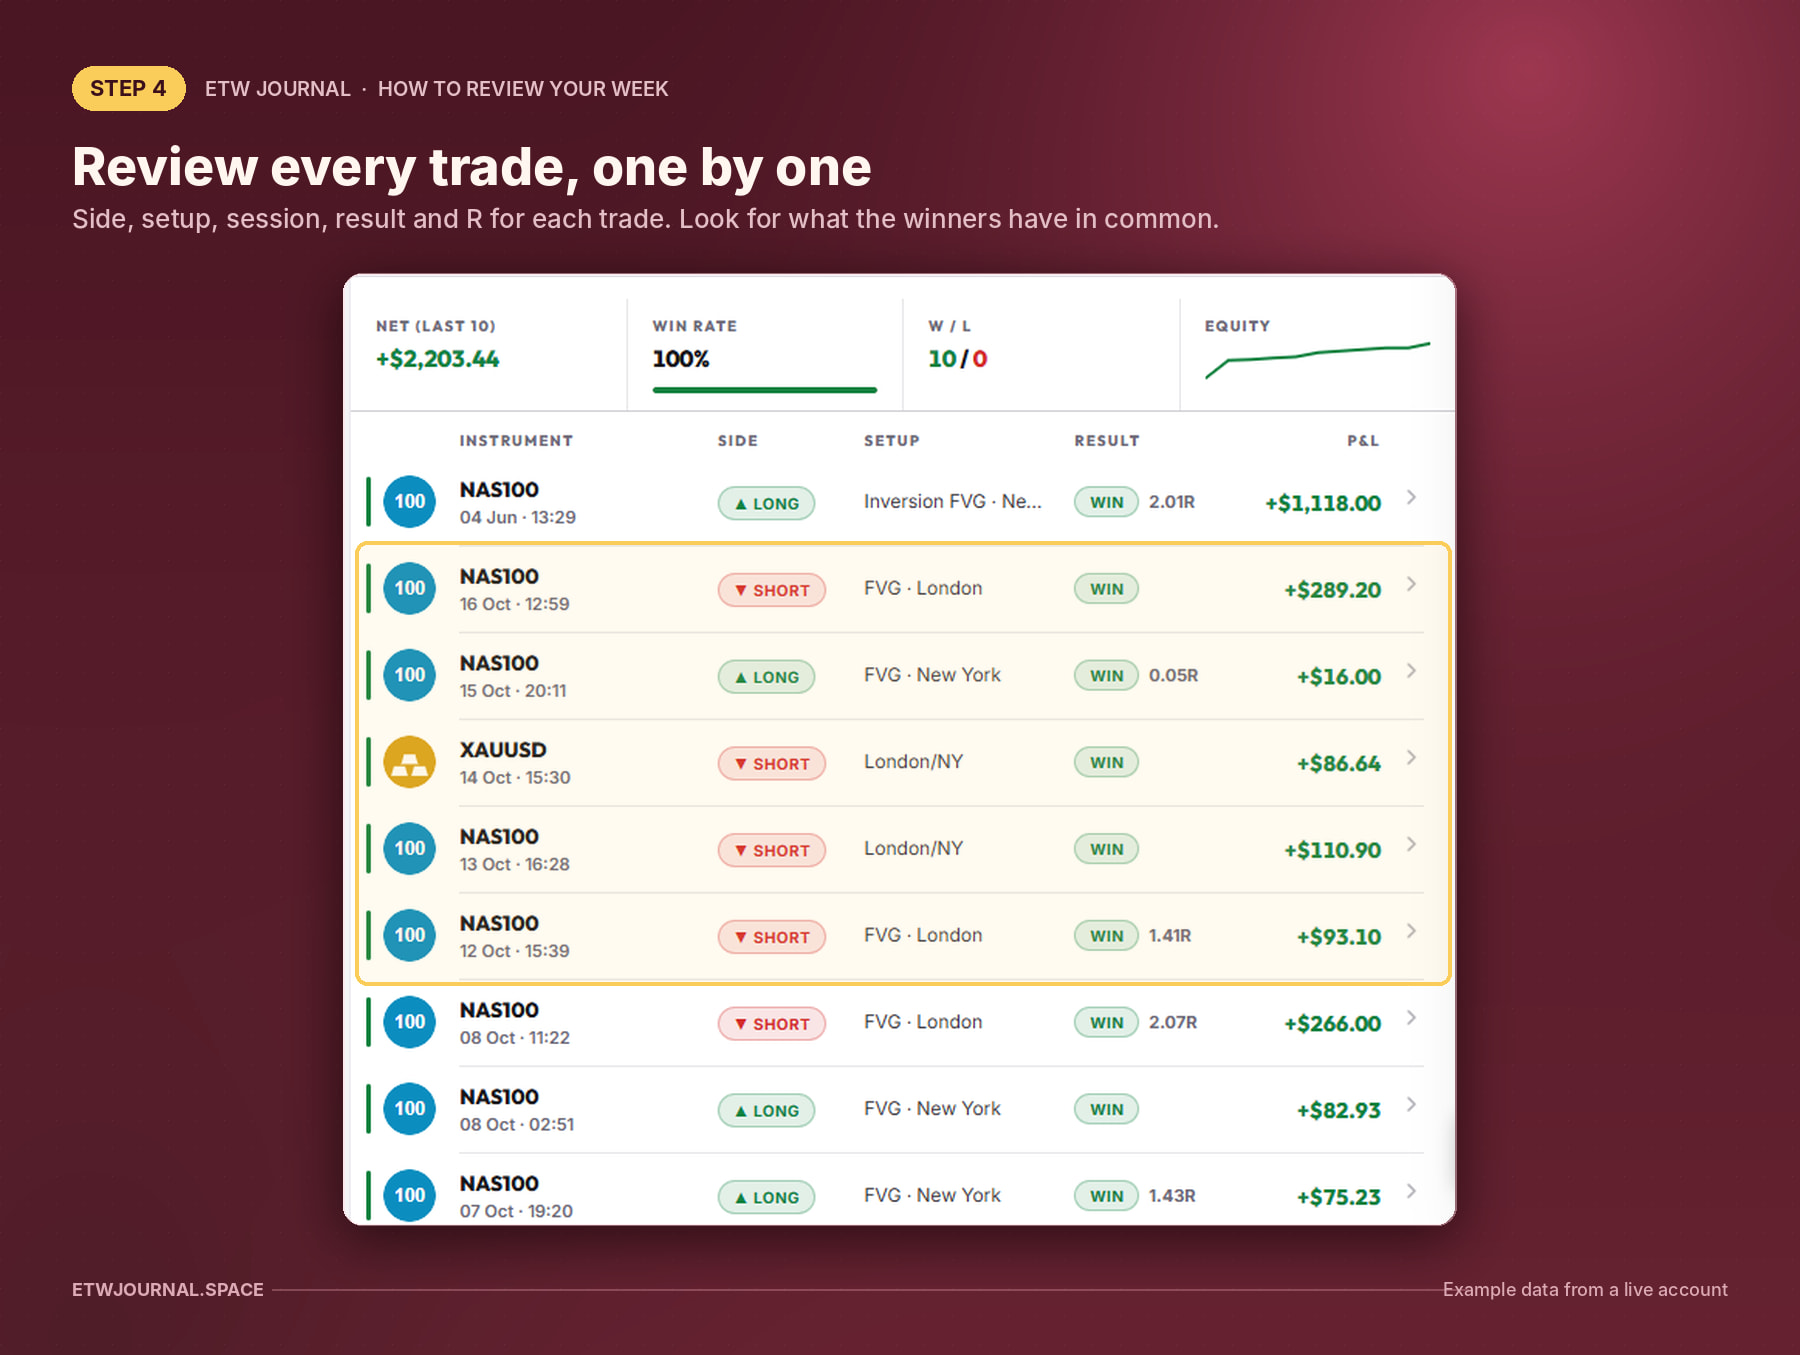
| Date | Instrument | Side | Setup | Result |
|---|---|---|---|---|
| Mon 12 Oct | NAS100 | Short | FVG · London | +$93.10 (1.41R) |
| Tue 13 Oct | NAS100 | Short | London/NY | +$110.90 |
| Wed 14 Oct | XAUUSD | Short | London/NY | +$86.64 |
| Thu 15 Oct | NAS100 | Long | FVG · New York (20:11) | +$16.00 (0.05R) |
| Fri 16 Oct | NAS100 | Short | FVG · London | +$289.20 |
Patterns jump out straight away:
- 4 of 5 trades were shorts, and they were the stronger trades. That matched the bearish weekly bias on NAS100 (see our NAS100 weekly outlook).
- The only long was the weakest trade: +0.05R, taken late in New York at 20:11, against the bias.
- London FVG shorts produced the two best results (+1.41R and +$289.20).
For each trade, ask
- Was this an A+ setup from my playbook, or did I force it?
- Was it in line with my higher-timeframe bias?
- Did I follow my entry, stop and target rules?
- How did I exit, and did I leave R on the table?
- How did I feel before and during the trade?
Replay your key trades in Trade Replay
Numbers tell you what happened. Trade Replay shows you how it happened. It lets you relive your actual executed trades bar by bar, so you can judge your execution, emotions and decisions as they unfolded, instead of from the final screenshot.
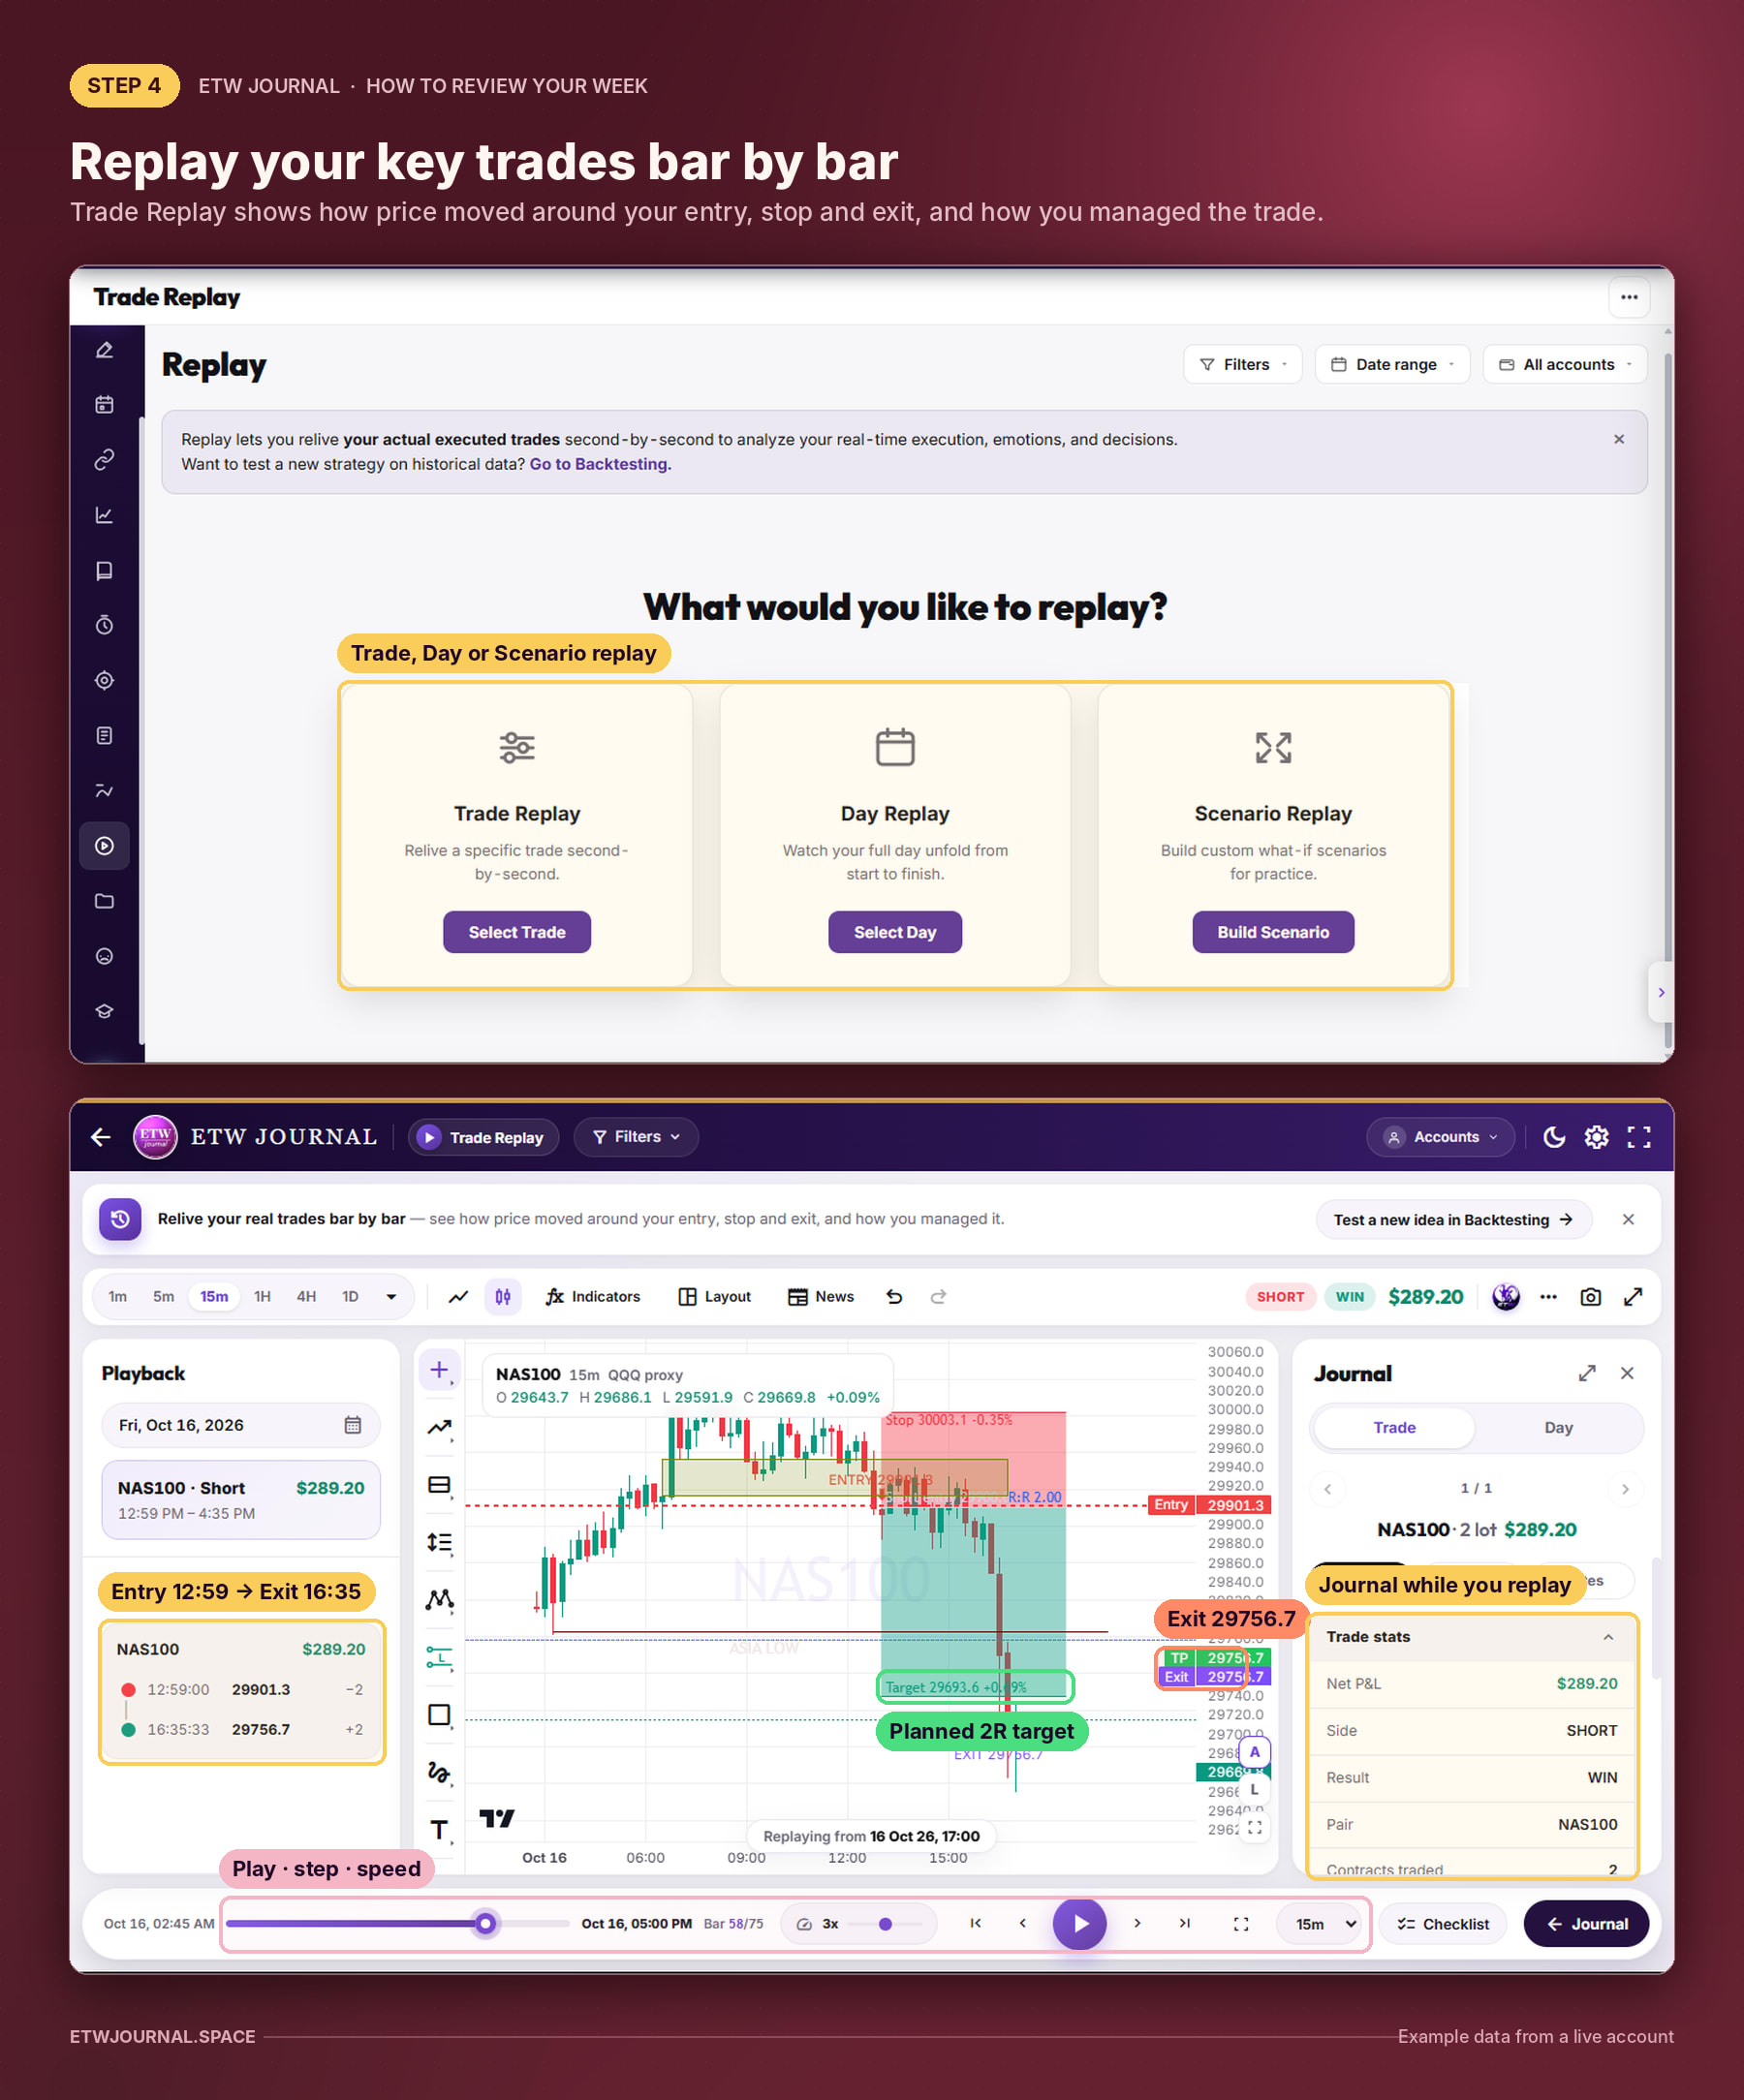
From the Replay page you can choose three modes:
- Trade Replay: relive one specific trade second by second. Use it for your best and worst trades of the week.
- Day Replay: watch a full trading day unfold from start to finish, including the moves you didn't take. Great for days with low discipline scores.
- Scenario Replay: build custom what-if scenarios to practise, for example "what if I had held to target?"
Use Filters, Date range and Accounts at the top to jump straight to the week you're reviewing.
What the replay revealed about Friday's trade
Here's Friday's biggest win, the NAS100 short worth +$289.20, replayed on the 15-minute chart:
- Executions panel: entry at 12:59:00 at 29901.3 (2 lots), exit at 16:35:33 at 29756.7.
- Position tool: stop at 30003.1 and a planned target at 29693.6, an R:R of 2.00.
- The exit came early. The trade was closed at 29756.7, roughly 1.4R instead of the planned 2R, and price went on to trade through the original target shortly after.
This one replay explains several numbers from the rest of the review: the "exited early" mistake, the 1:1.22 average win/loss ratio and the ETW Score's weakest axis. On paper it was a great trade. In the replay, you can see it left about 0.6R on the table.
How to use the replay screen
- Playback controls (bottom): play, step forward or back one bar, jump to the start or end, and change speed (e.g. 3x). The bar counter (e.g. Bar 58/75) shows where you are.
- Timeframes (top left): switch between 1m, 5m, 15m, 1H, 4H and 1D to see the trade in context.
- Drawing tools, Indicators, Layout and News: mark your levels (like the Asia low here) and check whether news hit during the trade.
- Journal panel (right): see the trade's stats, strategy and notes while you watch, and switch to the Day tab for the day's journal.
- Checklist: run through your entry checklist against the replay. Did the setup really meet your rules?
Weekly habit: replay at least your best trade and your worst (or smallest) trade every week. Pause at the entry and ask, "Would I take this again?" Then pause at the exit and ask, "Did I follow my plan?" Replaying a trade also earns a discipline bonus on your Discipline Calendar.
Step 5: Find out what made the money
Next, break the week down by instrument and strategy, then compare it with your all-time numbers.
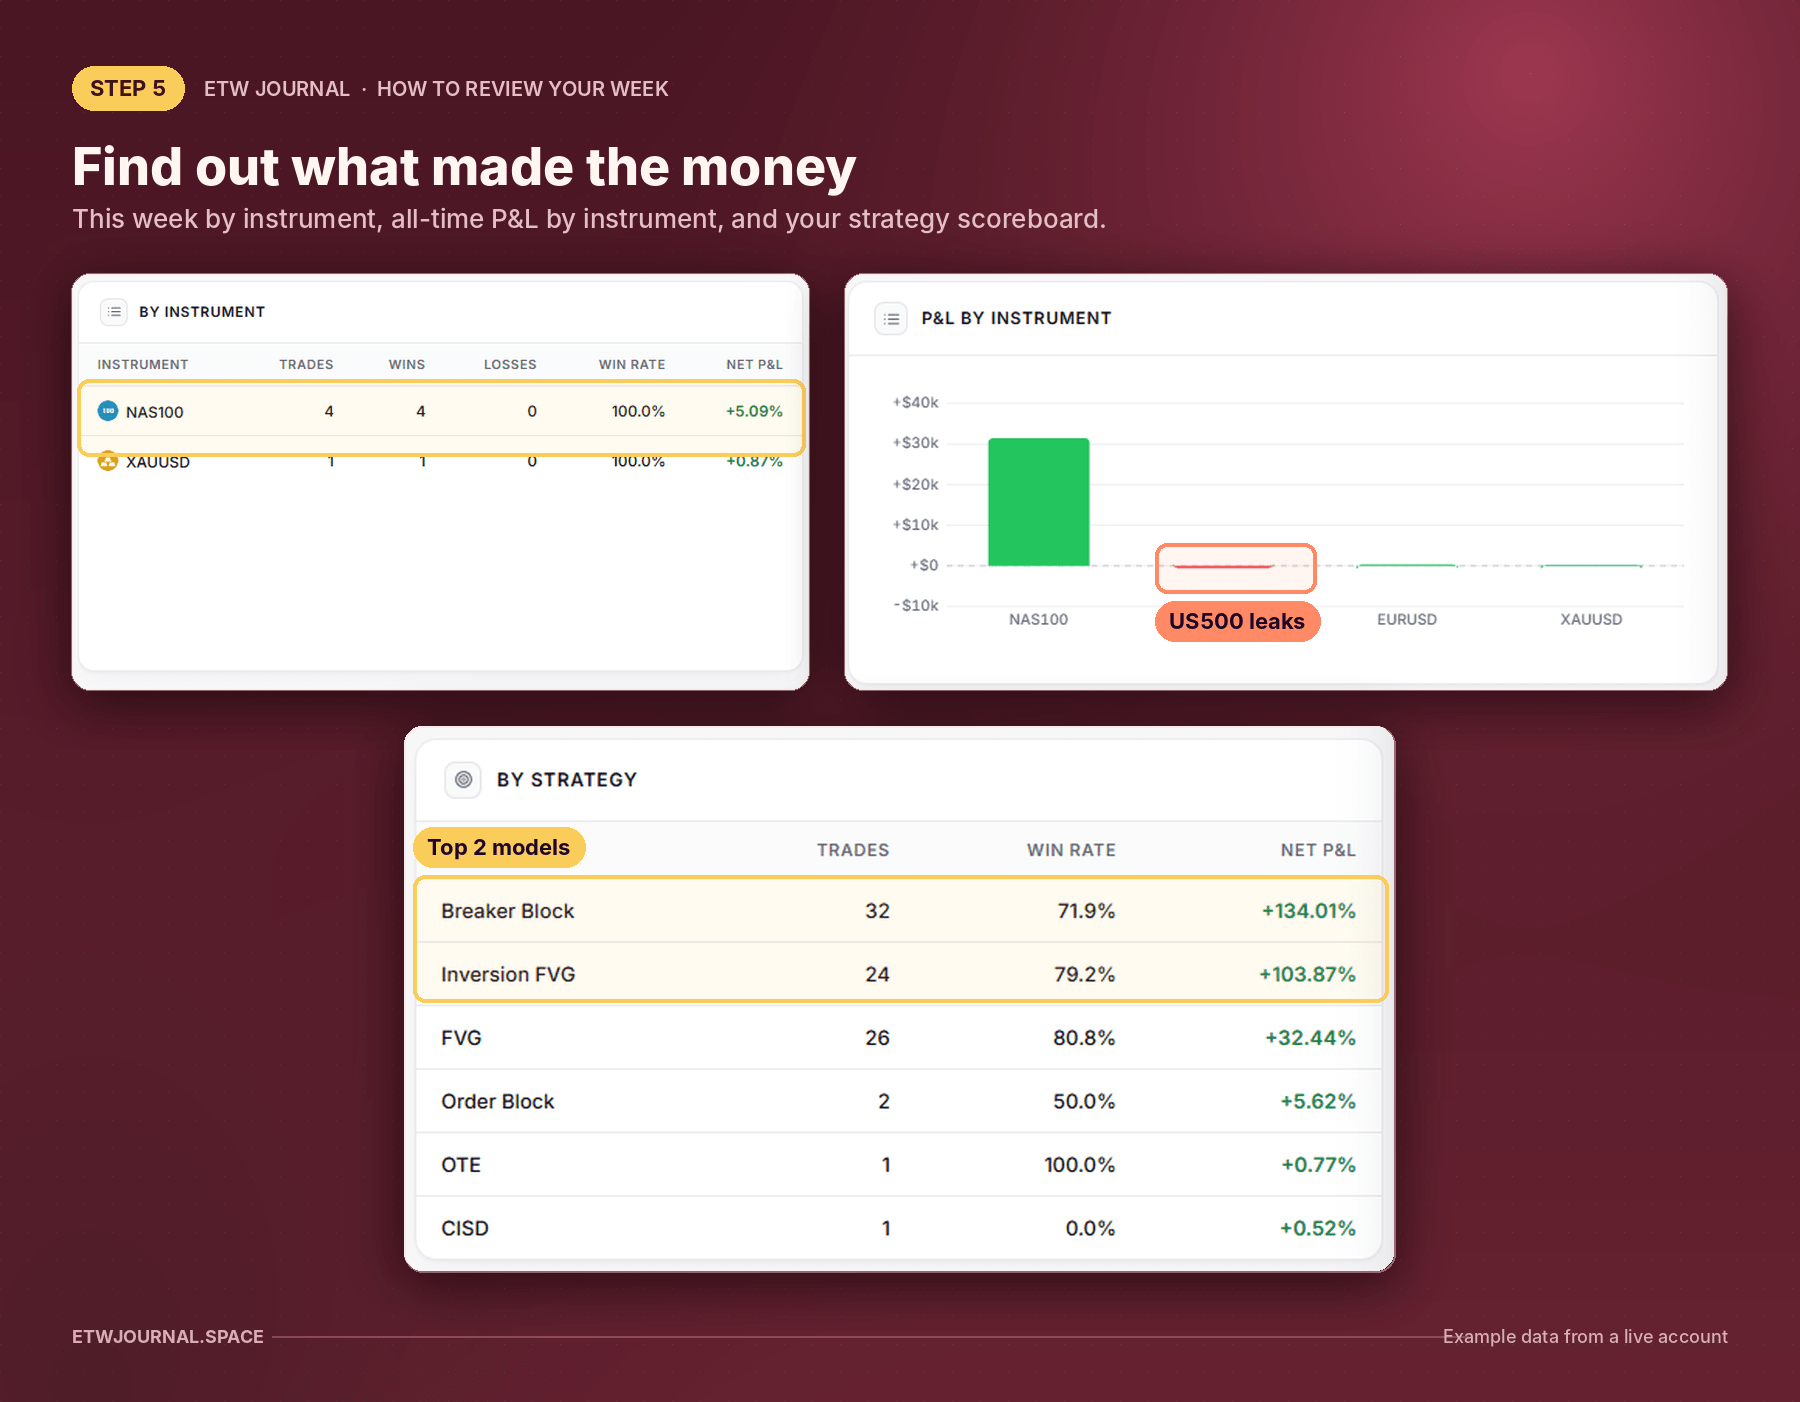
This week by instrument
- NAS100: 4 trades, 4 wins, 100% win rate, +5.09%.
- XAUUSD: 1 trade, 1 win, +0.87%.
All-time P&L by instrument
Zooming out makes the edge obvious: NAS100 has made over $30k, while US500 is slightly negative and EURUSD and XAUUSD are roughly flat. The weekly review question is: did I trade where my edge is? This week, yes: 4 of 5 trades were NAS100.
By strategy
- Breaker Block: 32 trades, 71.9% win rate, +134.01%.
- Inversion FVG: 24 trades, 79.2%, +103.87%.
- FVG: 26 trades, 80.8%, +32.44%.
- Order Block, OTE and CISD have only 1–2 trades each, too few to judge.
Notice that FVG has the highest win rate but much lower net P&L than Breaker Blocks and Inversion FVGs. A high win rate doesn't always mean high profit; R per trade matters. This week every trade was an FVG or London/NY setup, so next week, watch for Breaker and Inversion FVG setups too.
Step 6: Compare sessions and models
When you trade matters as much as what you trade. Check the Session Breakdown and the Win rate by session / model charts.
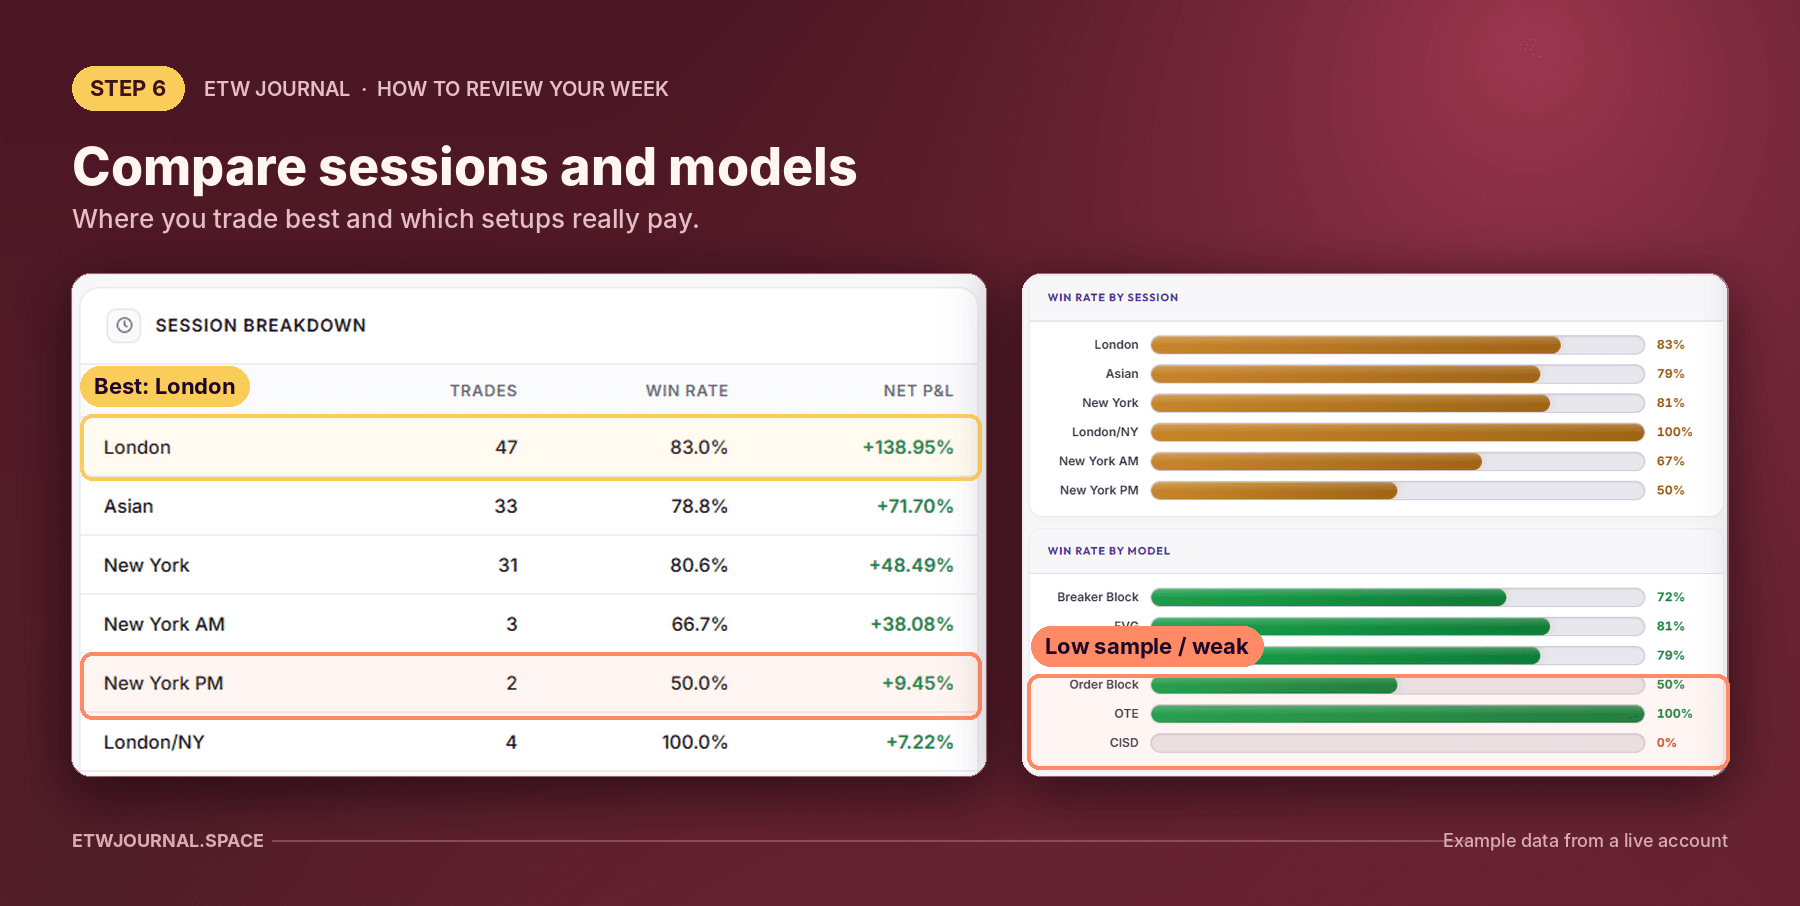
- London: 47 trades, 83.0% win rate, +138.95%. Your best session.
- Asian: 33 trades, 78.8%, +71.70%.
- New York: 31 trades, 80.6%, +48.49%.
- New York PM: only 2 trades at 50% win rate.
- London/NY: 4 trades, 100% win rate.
By model, OTE (100%) and CISD (0%) each have just one trade, so treat those numbers as noise, not signal. Order Block sits at 50% on 2 trades. Keep logging them before you draw conclusions.
Rule of thumb: don't change your plan based on fewer than 20 trades in a category. Use small samples as questions, not answers.
Step 7: Check days of the week and trading hours
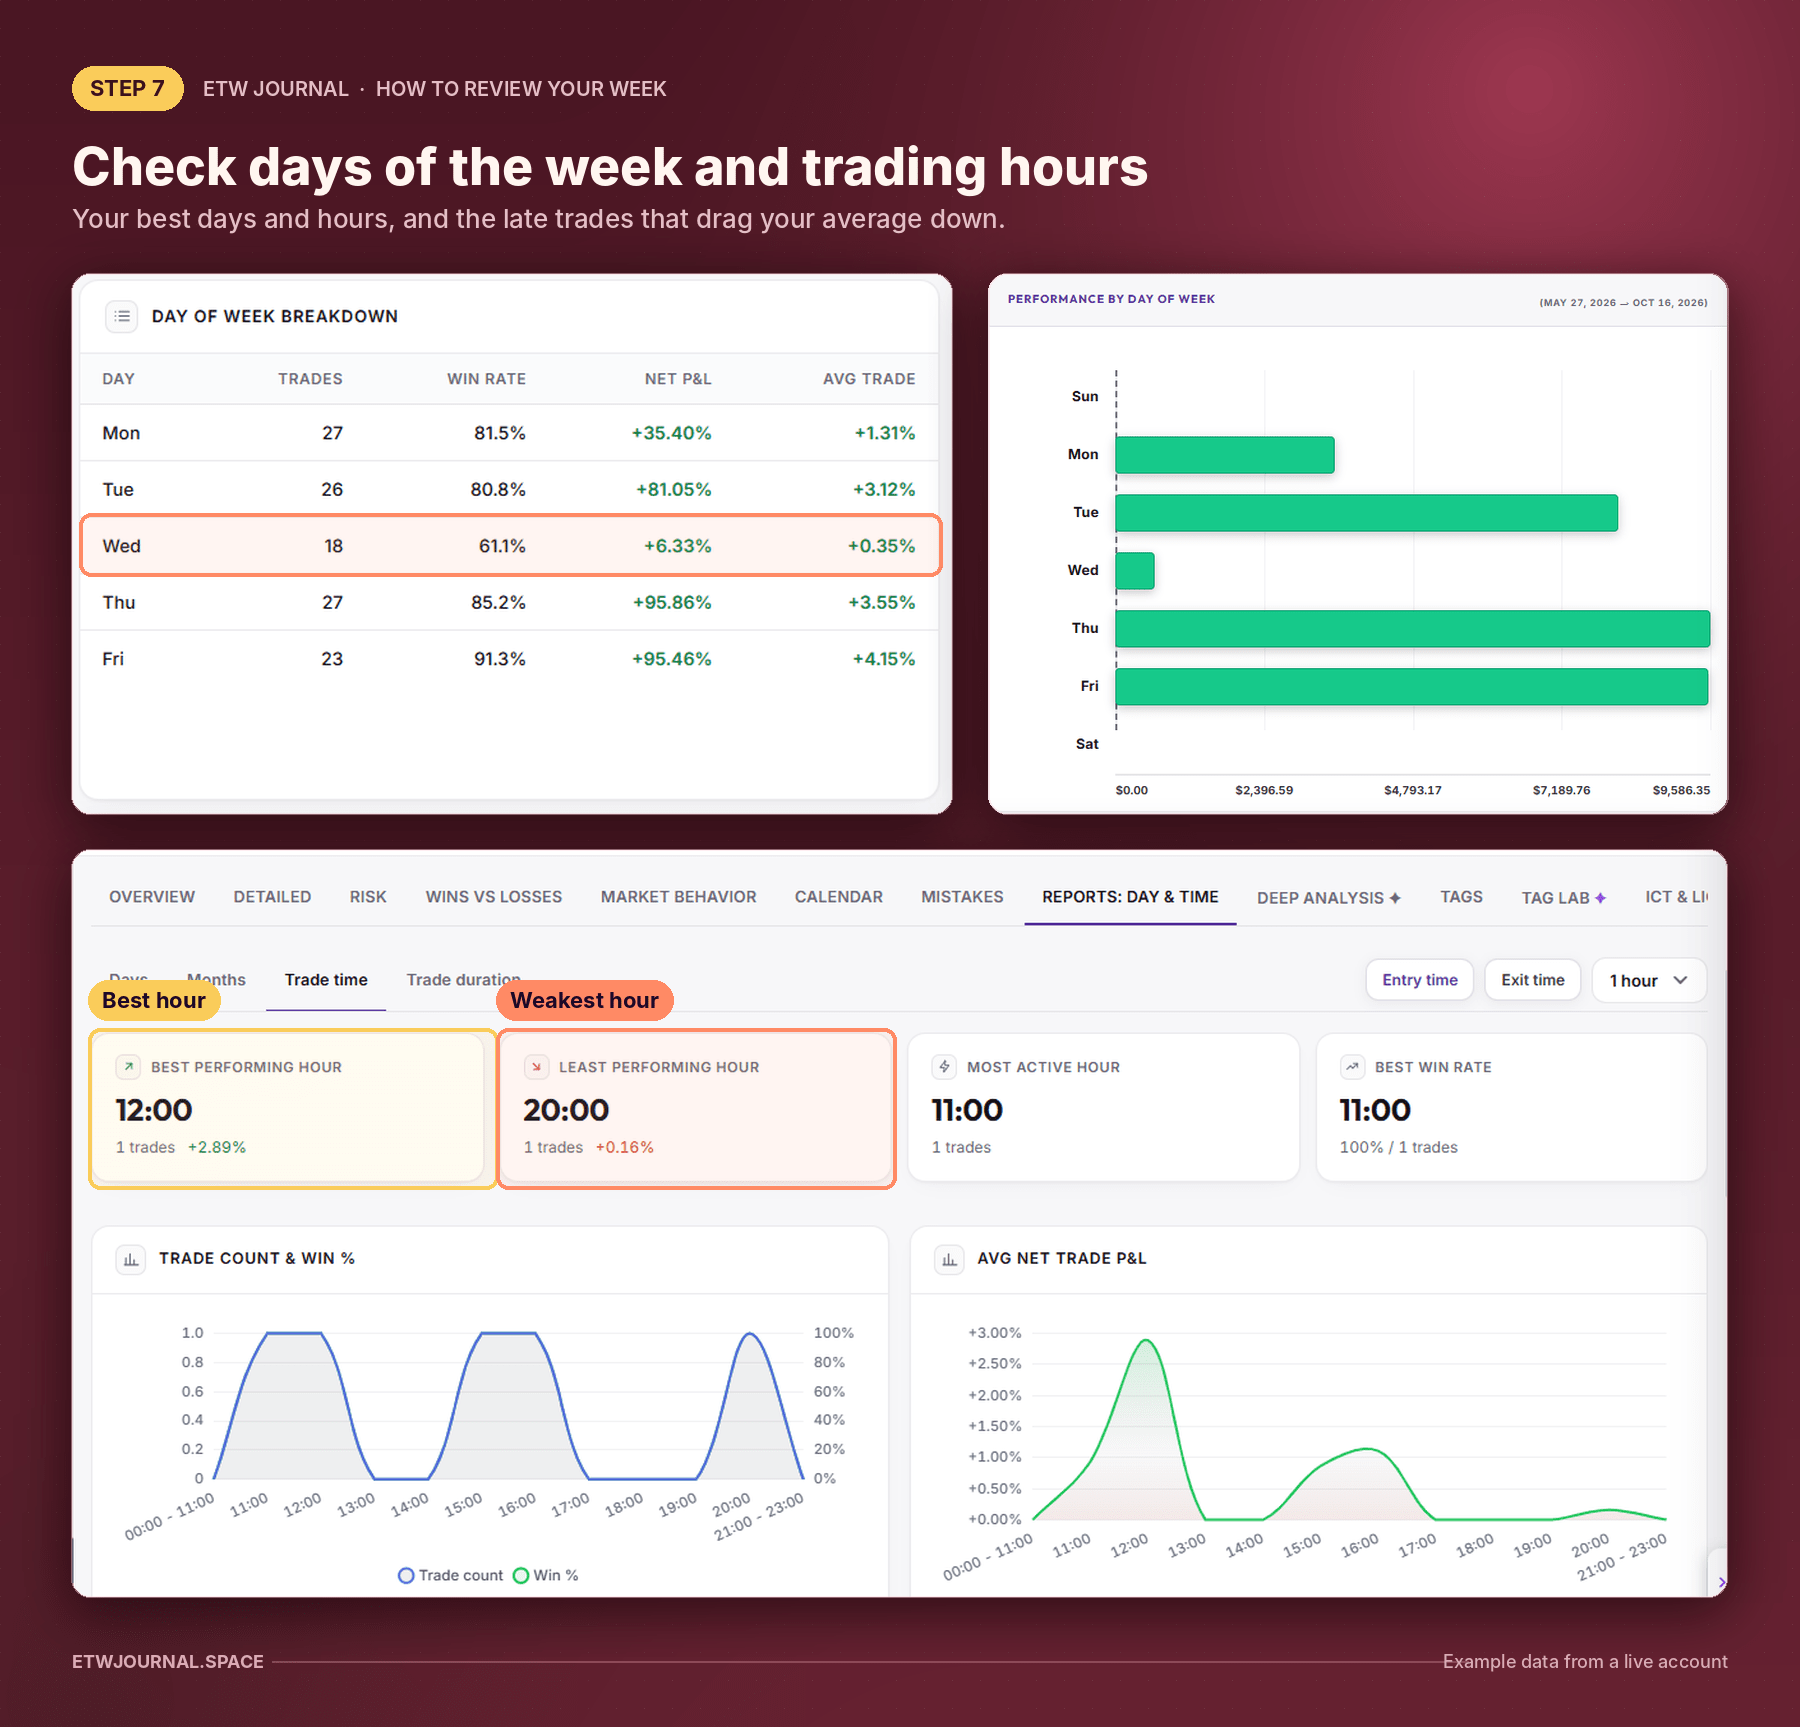
Under Reports: Day & Time you can see how you perform on each weekday and at each hour.
Days
- Thursday (85.2%, +95.86%) and Friday (91.3%, +95.46%) are the strongest days.
- Tuesday is strong too: +81.05%.
- Wednesday is the weak spot: 18 trades, 61.1% win rate and only +6.33%, with an average trade of +0.35%.
A practical fix: trade smaller on Wednesdays, or only take A+ setups that day. This week's Wednesday trade (XAUUSD) won, but it was also one of the two low-discipline days.
Hours
The Trade time tab for this week shows the best performing hour at 12:00 (+2.89%) and the least performing at 20:00 (+0.16%). That 20:00 trade is the late New York long from Thursday. Late-session trades against the bias are worth flagging in your plan.
Step 8: Audit your risk
The Risk Tag Monitor shows how each risk size has performed. Every trade is counted once for each risk tag assigned to it.
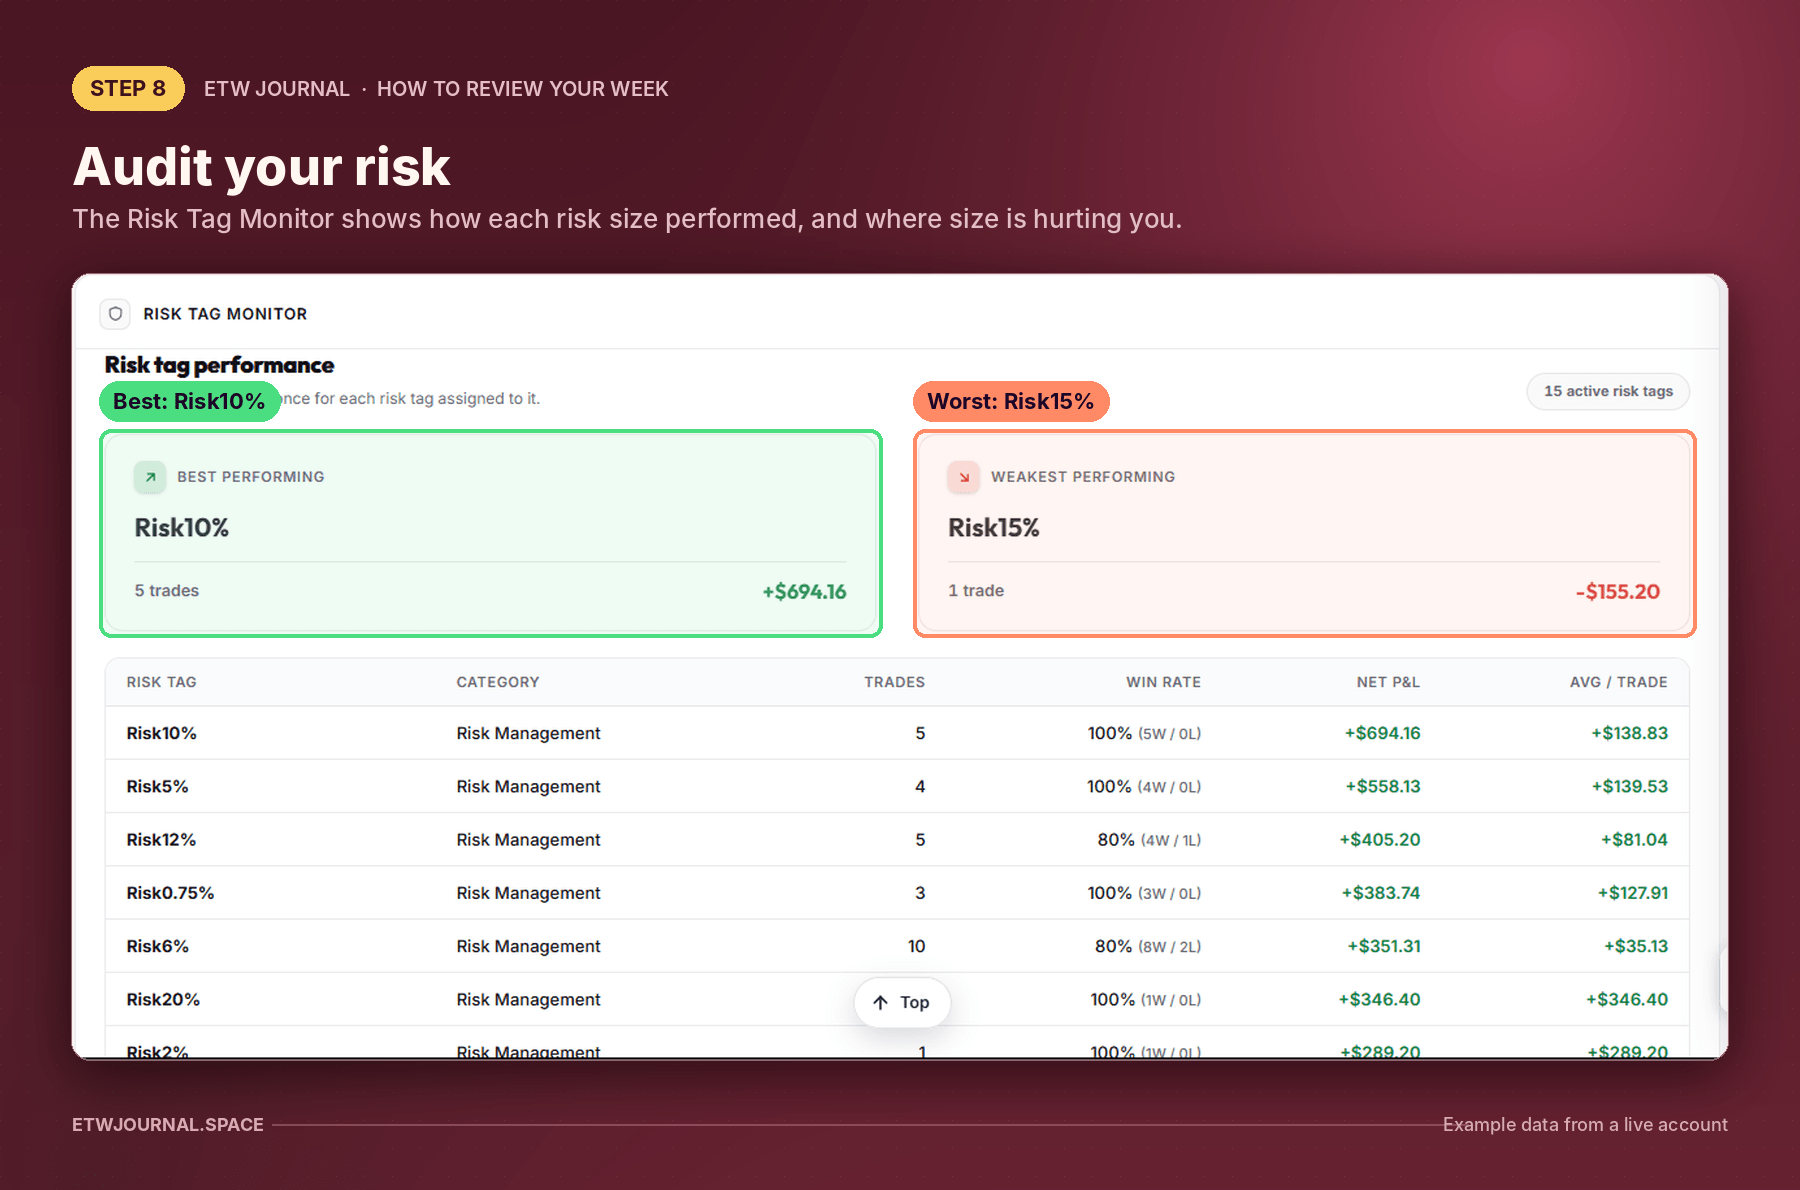
- Best performing: Risk10%, 5 trades, +$694.16.
- Weakest performing: Risk15%, 1 trade, −$155.20.
- There are 15 active risk tags, from Risk0.75% to Risk20%.
The weekly question isn't "which risk size made the most?" It's "is my risk consistent?" Fifteen different risk sizes means position size is changing from trade to trade, which makes results harder to trust and drawdowns harder to control. Pick a fixed risk per trade and stick to it next week.
Watch out: High-risk tags with 100% win rates (like Risk20%) look great until the first loss. Judge risk by what one losing trade would do to your account, not by past wins.
Step 9: Grade your rules and mistakes
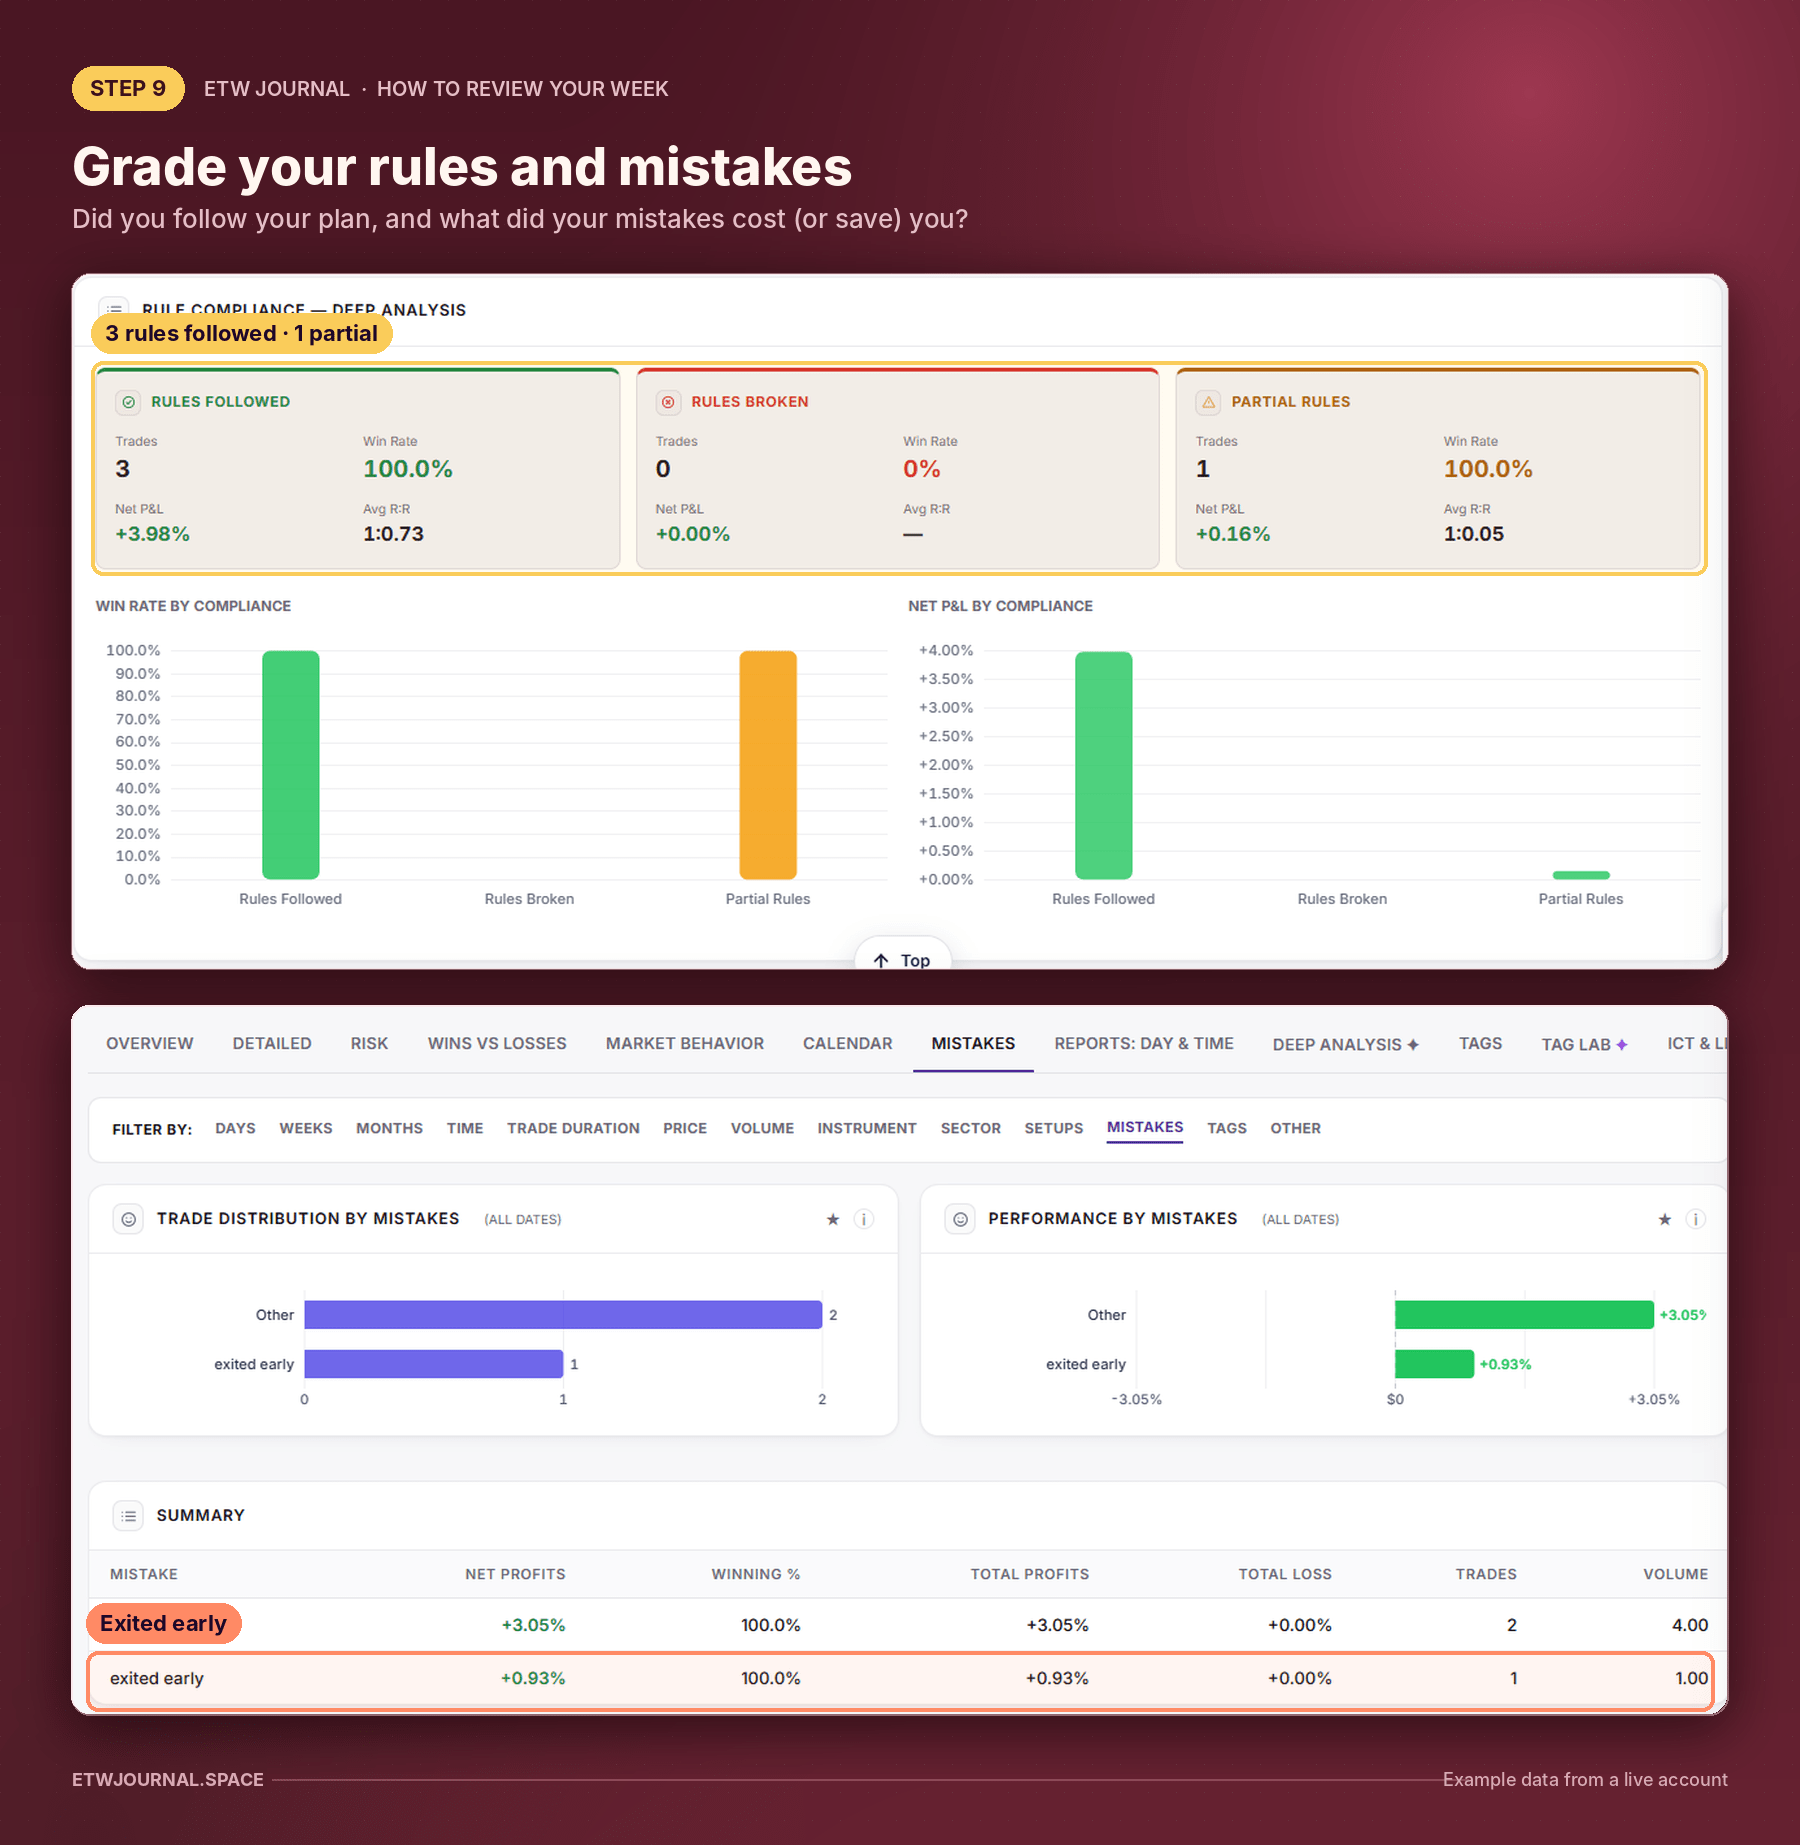
Under Deep Analysis, Rule Compliance splits trades into rules followed, rules broken and partial rules. The Mistakes report shows which mistakes you tagged and what they did to your P&L.
Rule compliance
- Rules followed: 3 trades, 100% win rate, +3.98%, avg R:R 1:0.73.
- Rules broken: 0 trades.
- Partial rules: 1 trade, +0.16%, avg R:R 1:0.05.
The partial-rules trade has the same 0.05 R:R as Thursday's late long. That lines up with what Steps 4 and 7 found: the trade where rules were bent was the weakest of the week.
Mistakes
- Other: 2 trades, +3.05%.
- Exited early: 1 trade, +0.93%.
These mistakes were still winners, which is exactly why they're easy to ignore. An early exit that wins +0.93% might have been +2% or +3% if you'd held to target. Also, "Other" is a vague label. Next week, tag mistakes more specifically (e.g. moved stop, late entry, no prep) so the report can teach you something.
Step 10: Use your tags and Tag Lab
Tags turn your journal into a database. If you tag emotions, conditions and outcomes on every trade, you can ask questions like "do I make more money when I'm calm?" New to tags? Start with our guide on how to use tags in ETW Journal.
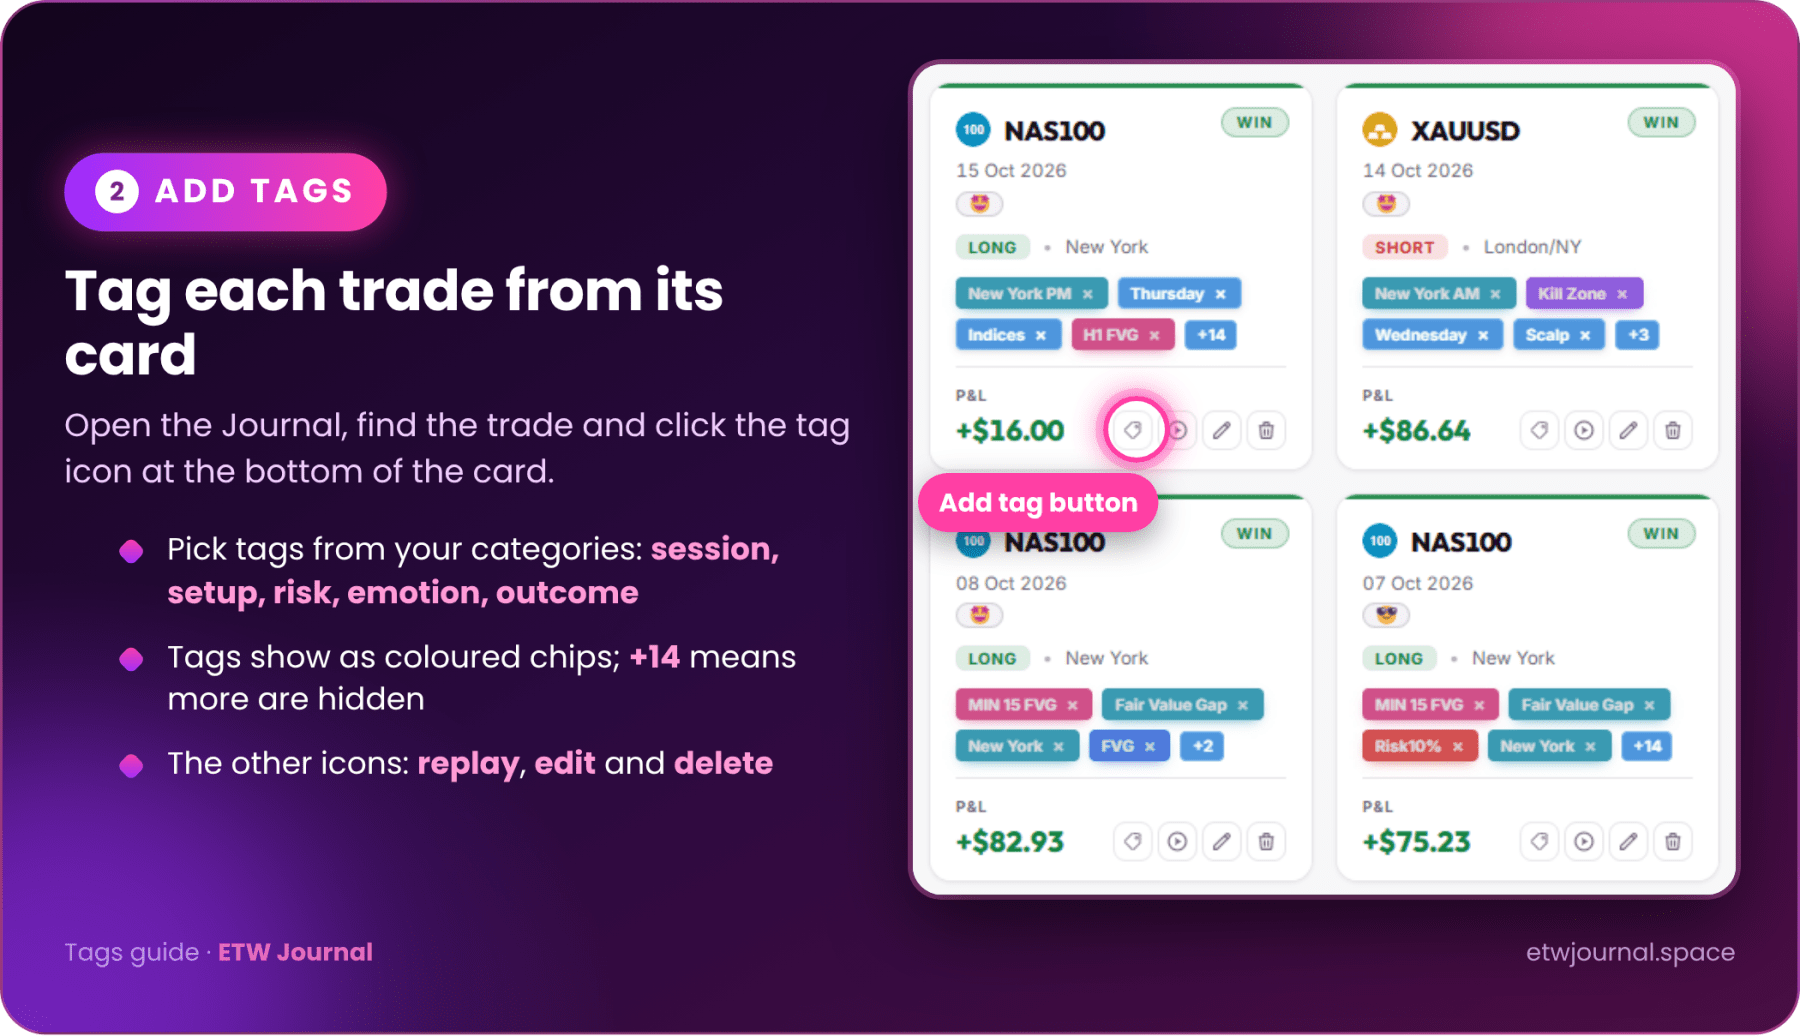
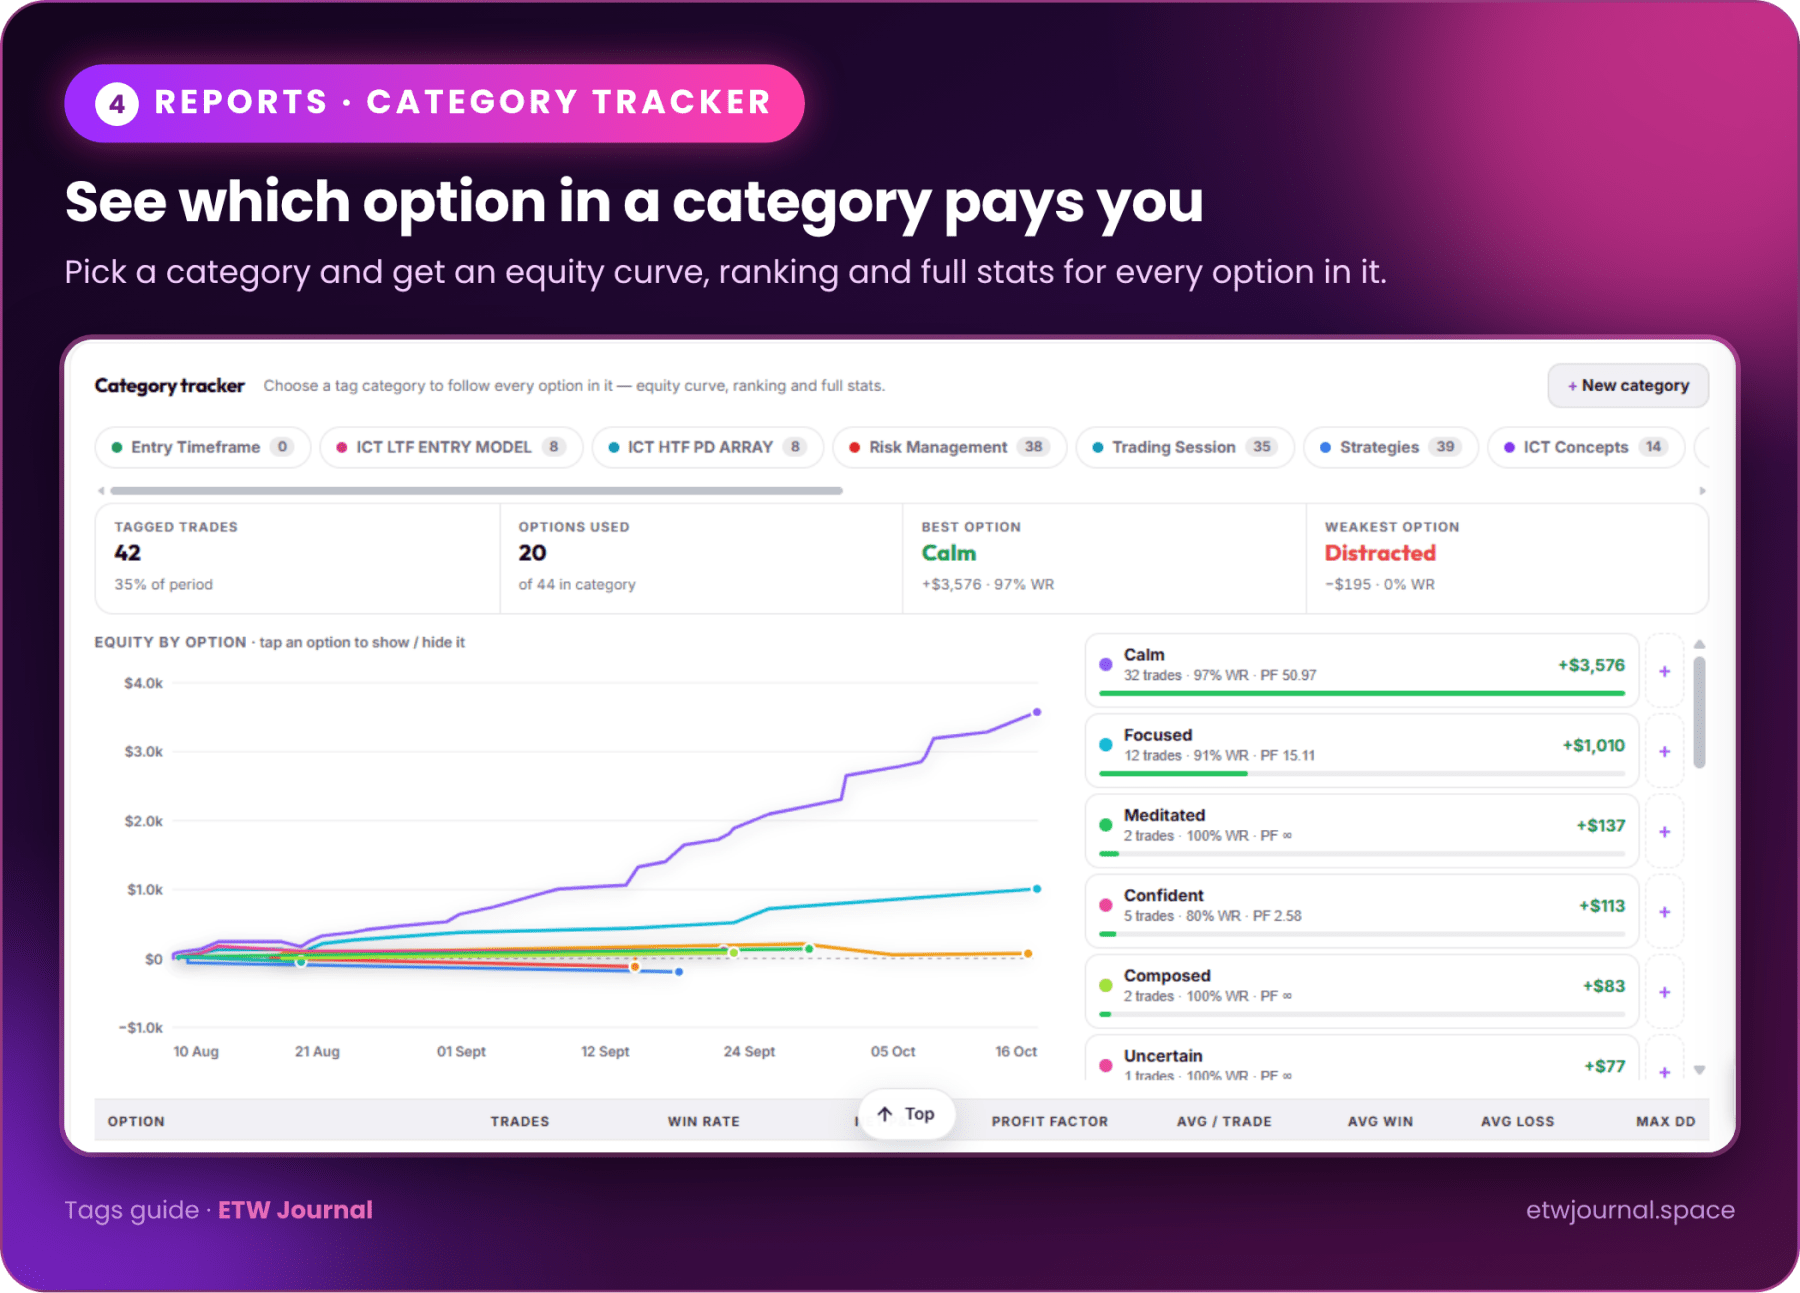
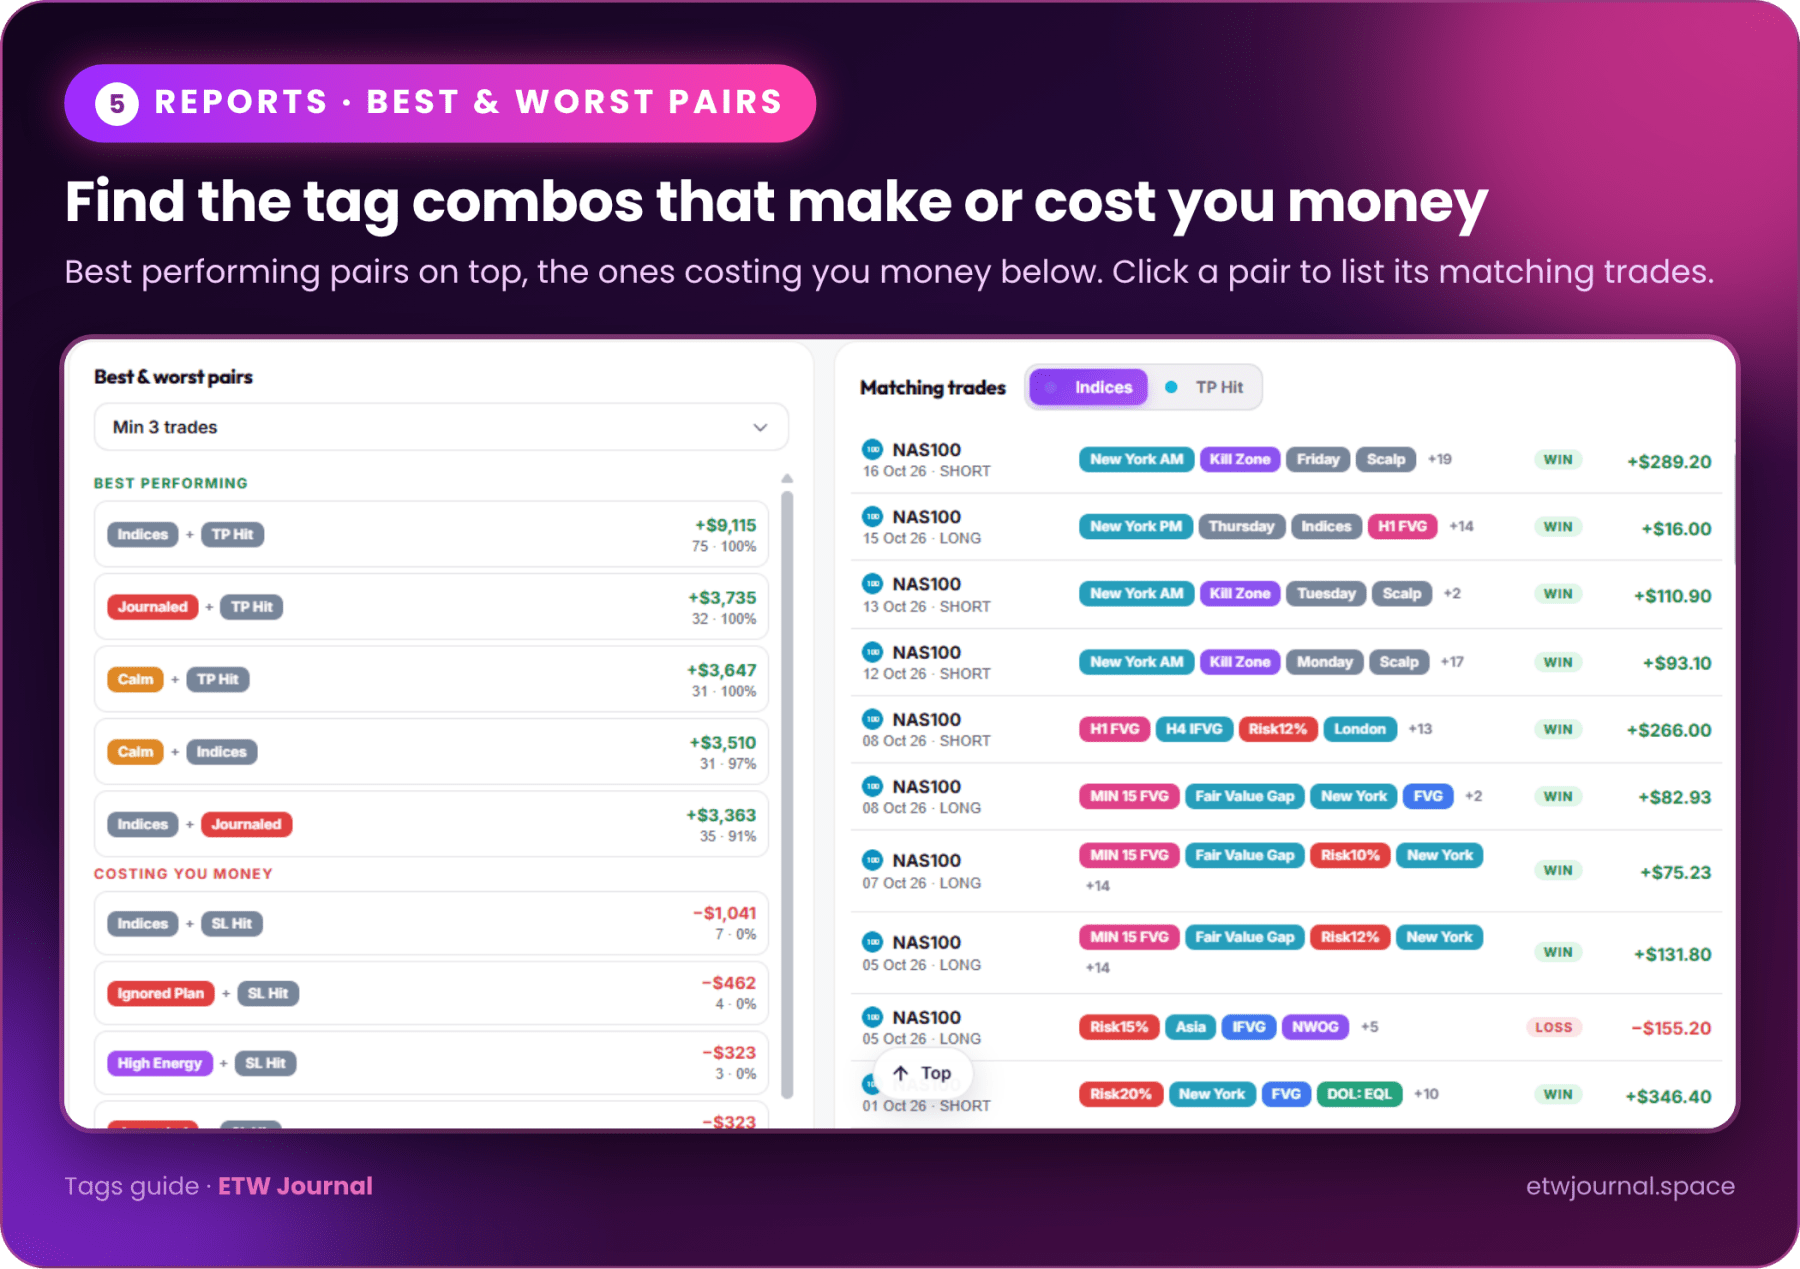
In your weekly review, check that every trade from the week is tagged: setup, session, emotion, risk and any mistakes. Then look at the Category tracker to see which tag options are making or losing money.
Test habits in Tag Lab
Tag Lab lets you build up to five tag combinations and compare them on one equity curve against all of your trades. Each combination can require All tags, Any of them, or Exclude some.
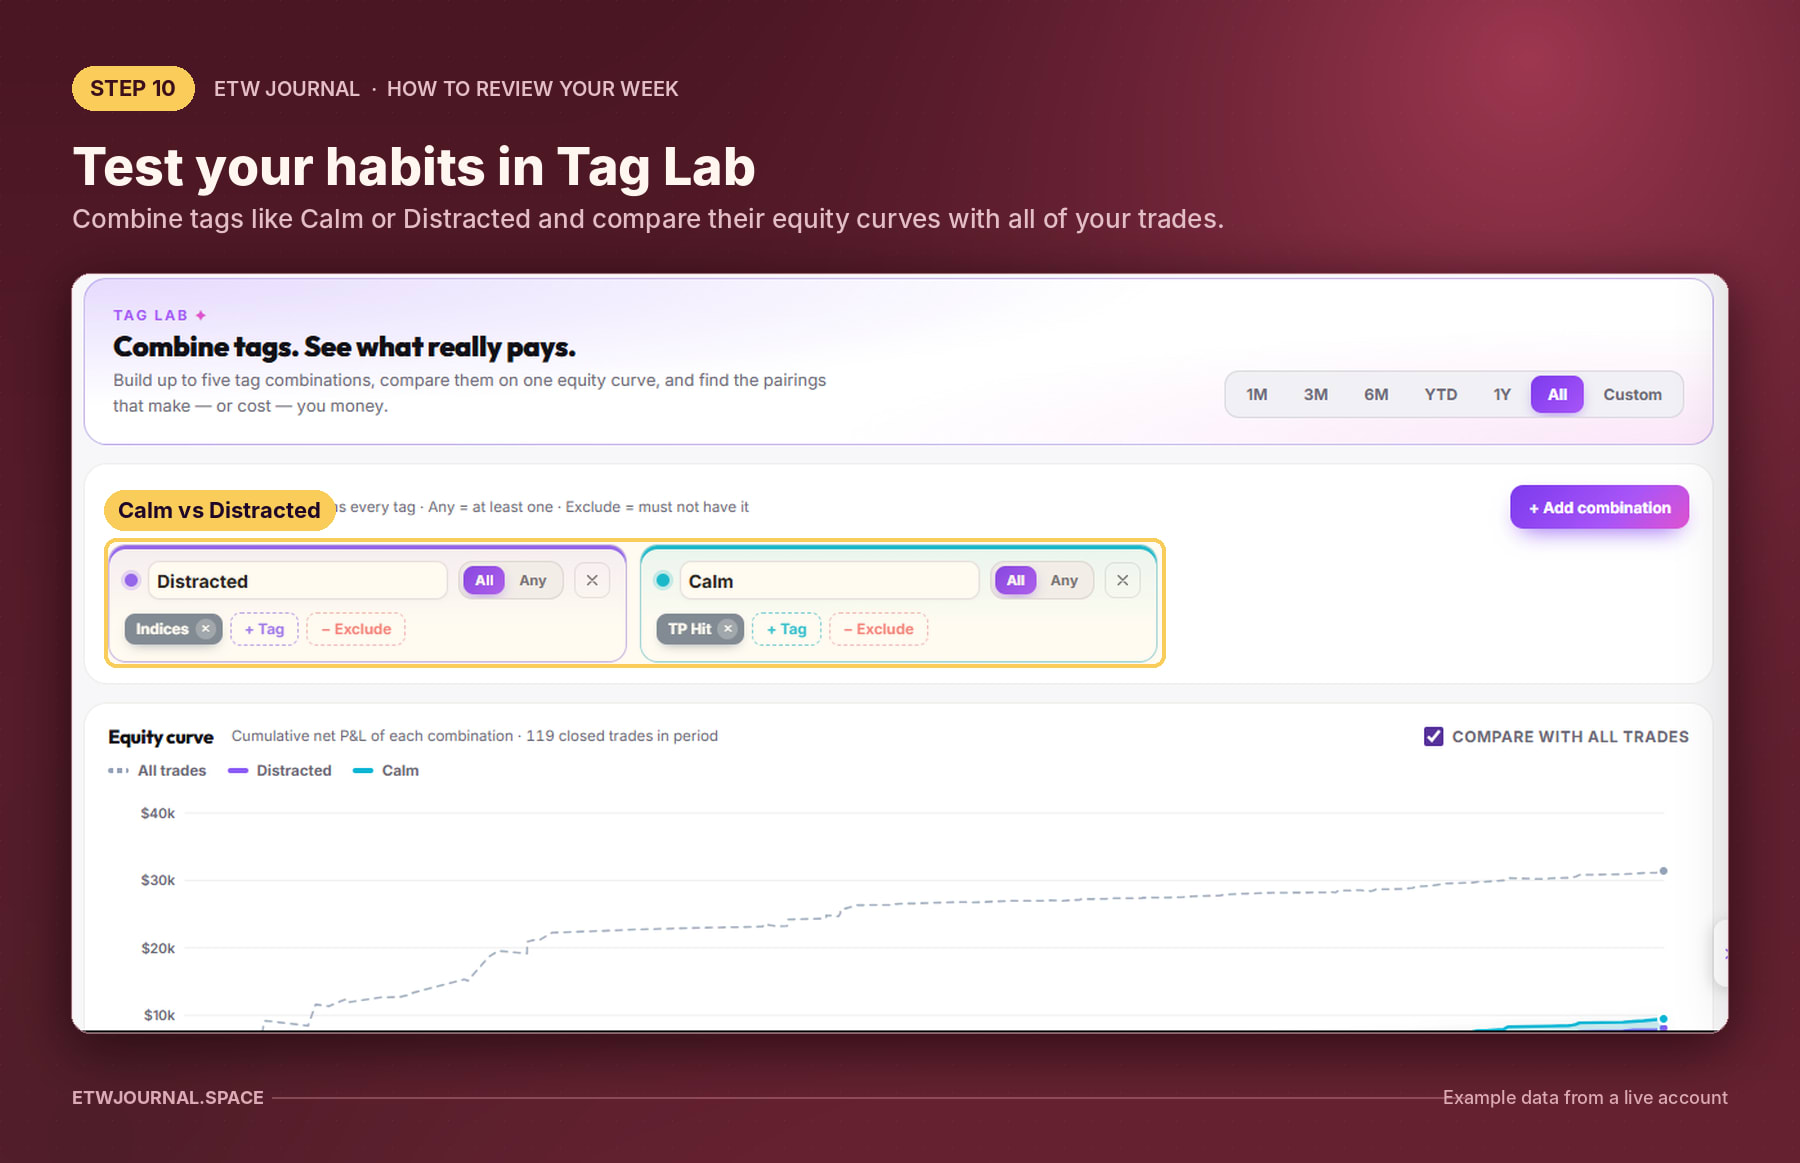
Example combinations to try in your weekly review:
- Distracted + Indices vs Calm + TP Hit: does your state of mind change your results?
- London + FVG vs New York PM: confirm your best session-setup pairing.
- Exclude "No prep": how much better are your results when you prepared?
Step 11: Zoom out to the big-picture numbers
Finish the data part of your review by looking at your overall statistics and your ETW Score. The question here: did this week move my long-term numbers in the right direction?
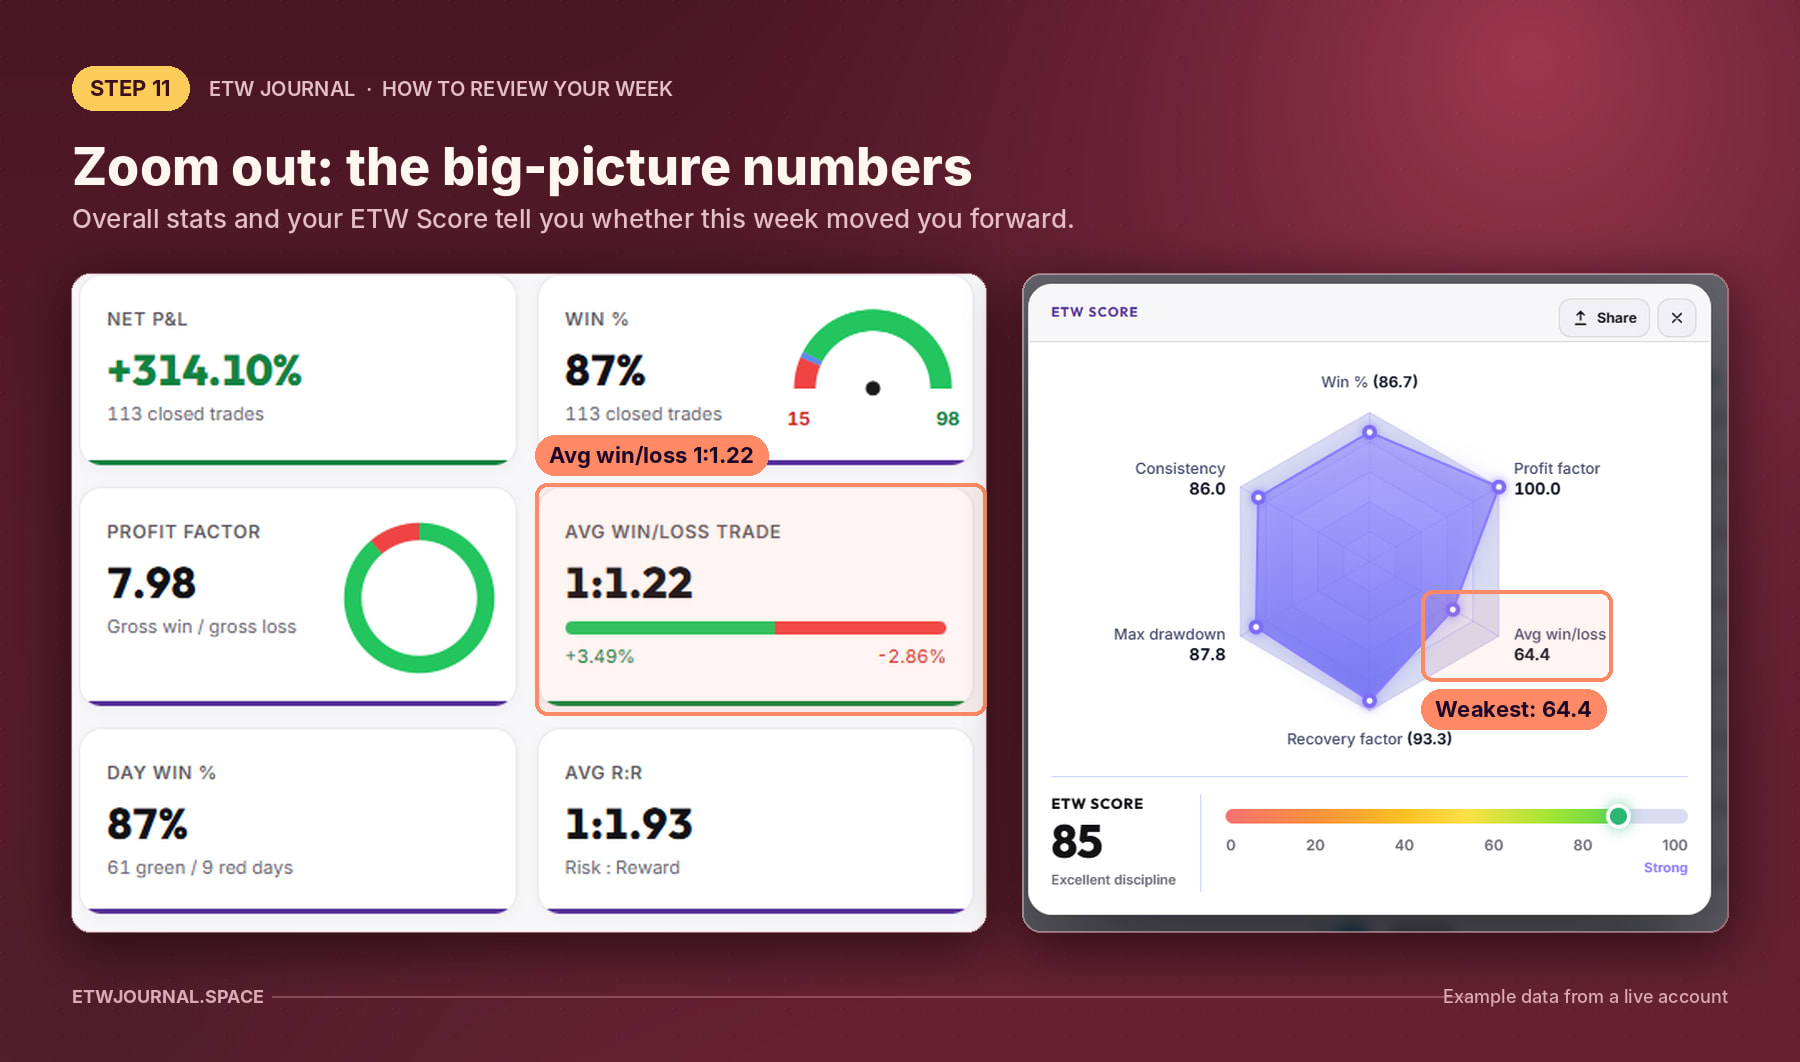
- Net P&L: +314.10% over 113 closed trades.
- Win rate: 87%. Day win rate: 87% (61 green / 9 red days).
- Profit factor: 7.98.
- Avg win / loss trade: 1:1.22 (+3.49% vs −2.86%).
- Avg R:R: 1:1.93.
The ETW Score is 85 (Excellent discipline). Its radar shows profit factor (100), recovery factor (93.3), max drawdown (87.8), win rate (86.7) and consistency (86.0) are all strong. The weakest axis is average win/loss at 64.4.
That connects everything we found this week: an early exit, a 0.05R trade and only 1:1.22 between average wins and losses. The biggest opportunity isn't winning more often. It's letting winners run to their planned targets.
Put it together: write your weekly summary
Data only helps if it turns into action. End every review by writing a short summary. Here's what it looks like for our example week:
Week of 12–16 Oct 2026: summary
Result: 5 trades, 5 wins, +$595.80. Discipline +201 pts.
Worked: London FVG shorts on NAS100, in line with the bearish weekly bias. Trading my best instrument. Selective, 1 trade per day.
Didn't work: Low discipline on Tue and Wed. No session prep or stop on Friday. A late New York long against the bias for just 0.05R. One early exit.
Next week: (1) Complete Session Prep and the checklist before every session. (2) Stop loss on every trade. (3) No trades after 19:00 or against the weekly bias. (4) Hold winners to target. (5) One fixed risk size.
Keep your plan to three to five specific rules. Vague goals ("be more disciplined") don't change behaviour; specific rules ("no trades after 19:00") do. Next weekend, start your review by checking whether you kept them.
Keep it in your Notebook
Write your summary where you'll see it again: the ETW Journal Notebook. It keeps all your notes in one searchable place, organised into folders and linked to your trading.
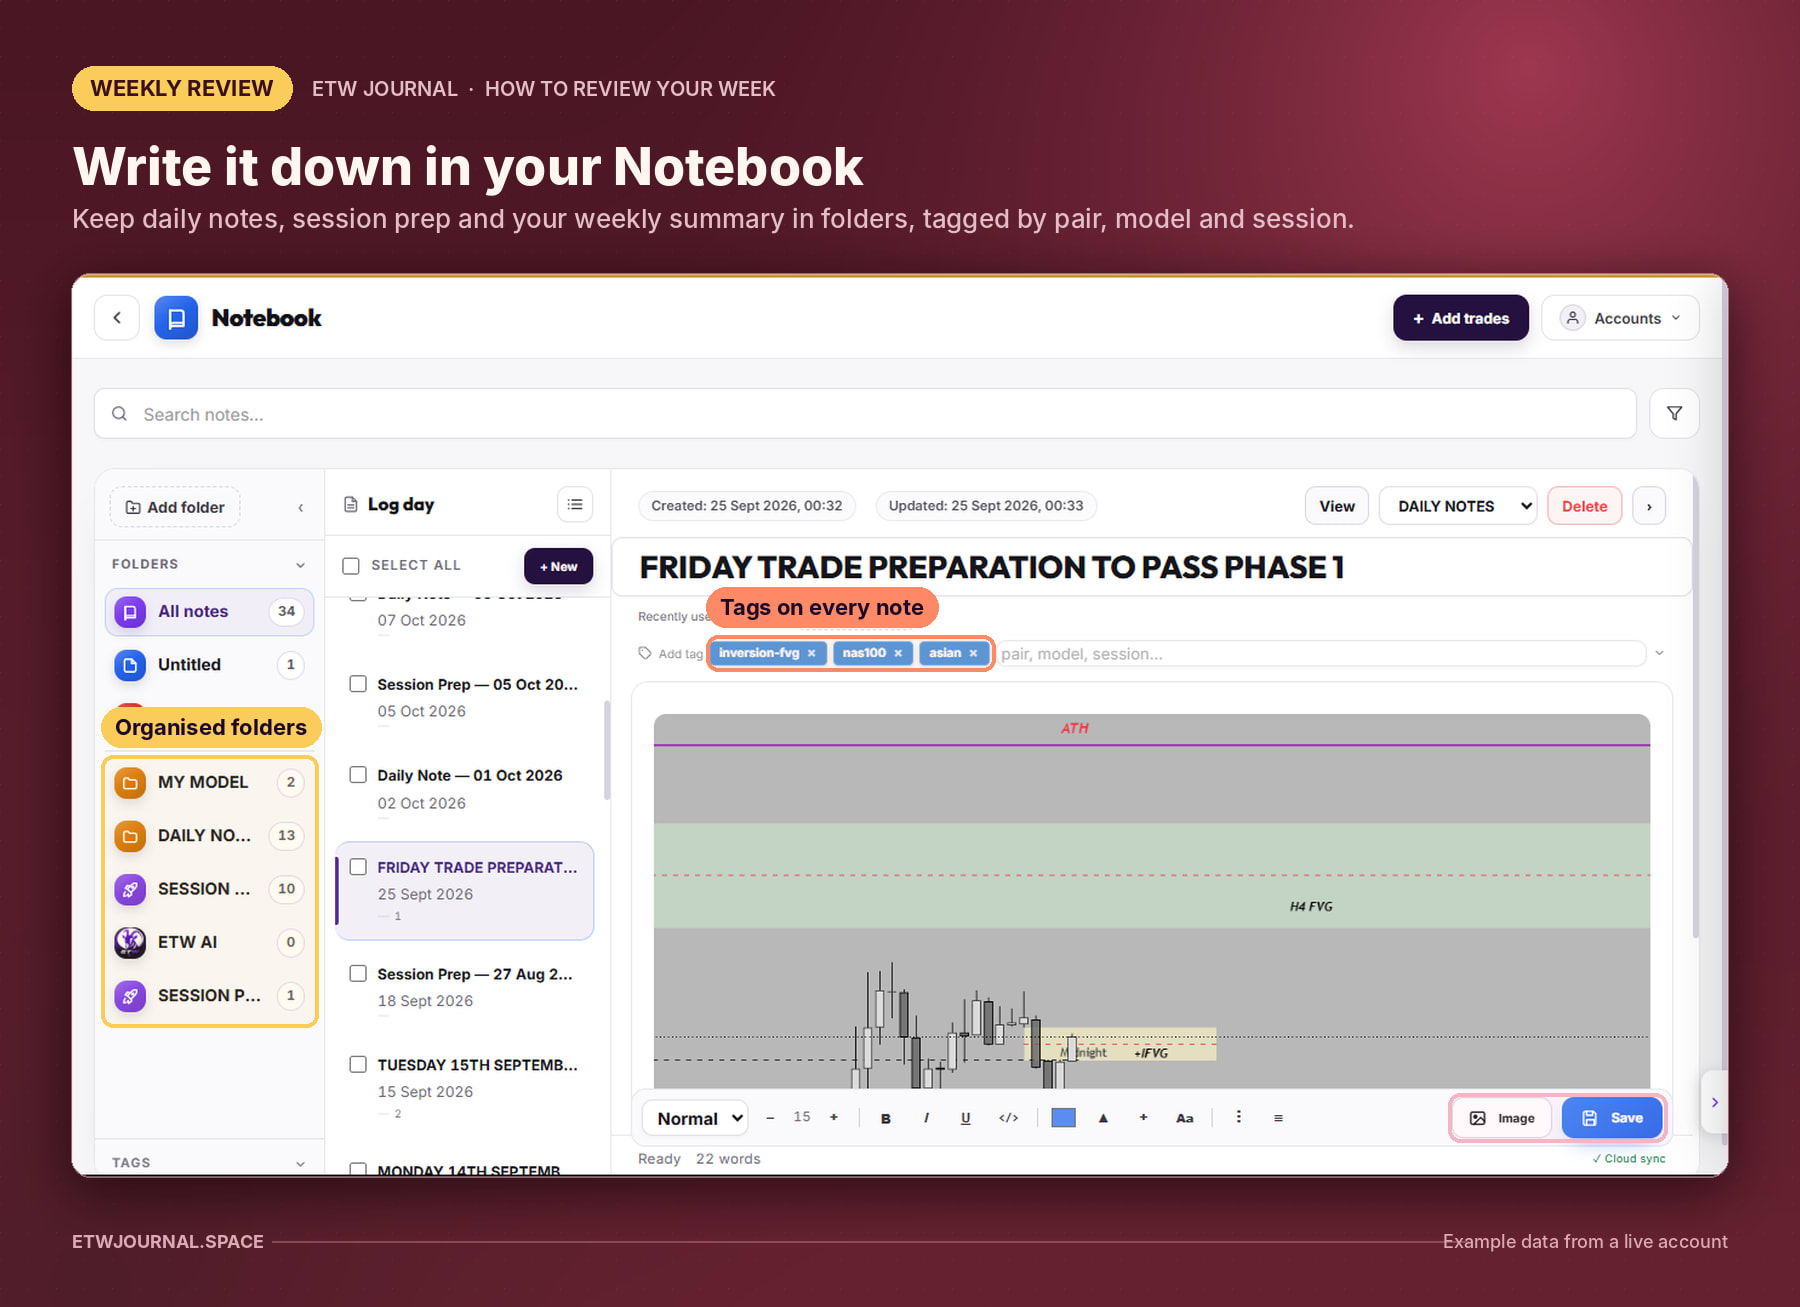
- Folders: keep separate folders such as My Model, Daily Notes and Session Prep. Add a Weekly Reviews folder with Add folder so every weekly summary lives together.
- Log day and + New: create a note for each day or for each weekly review. Notes show their created and updated dates, and sync to the cloud.
- Tags: tag notes by pair, model and session (e.g. inversion-fvg, nas100, asian), then search or filter to find every note about a setup.
- Images and charts: paste your marked-up charts (like the H4 FVG and IFVG levels above) straight into the note with Image.
- Templates: use + Add template to save your weekly review questions as a template, so every review follows the same structure.
Your Notebook also feeds your discipline score. Session prep notes and daily notes earn points, which is exactly what was missing on Friday in Step 3. Write next week's game plan in Session Prep before each session.
Your weekly review checklist
- Filter Reports to Monday–Friday and check the trade count.
- P&L Calendar: daily results, weekly total, biggest and smallest days.
- Discipline Calendar: compare with P&L, click into low-score days.
- Trade by trade: setup, bias, rules, exit and emotions. Replay your best and worst trades in Trade Replay.
- Instruments & strategies: did you trade where your edge is?
- Sessions & models: best and worst sessions, small samples flagged.
- Days & hours: weak days and late-session trades.
- Risk: was risk per trade consistent?
- Rules & mistakes: compliance and what mistakes cost you.
- Tags & Tag Lab: all trades tagged, combinations tested.
- Big picture: overall stats and ETW Score. Then write your summary and 3–5 rules for next week in your Notebook.
Do this every weekend and, within a month, you'll know your edge better than most traders ever will. Pair it with our weekly market outlooks in Weekly Trading Insights to plan the week ahead.
The account data in this guide is shown as an example of how to use ETW Journal's review tools. It is for educational purposes only and is not financial advice. Trading involves substantial risk.