 ETW

A trendline is one of the simplest tools on any chart: two clicks and you have a line. Yet most traders either draw them badly or trade every touch blindly. This guide shows what a trendline really tells you, how to draw one that the market actually respects, and how to turn it into continuation and reversal trades with a clear entry, stop and target.
What is a trendline?
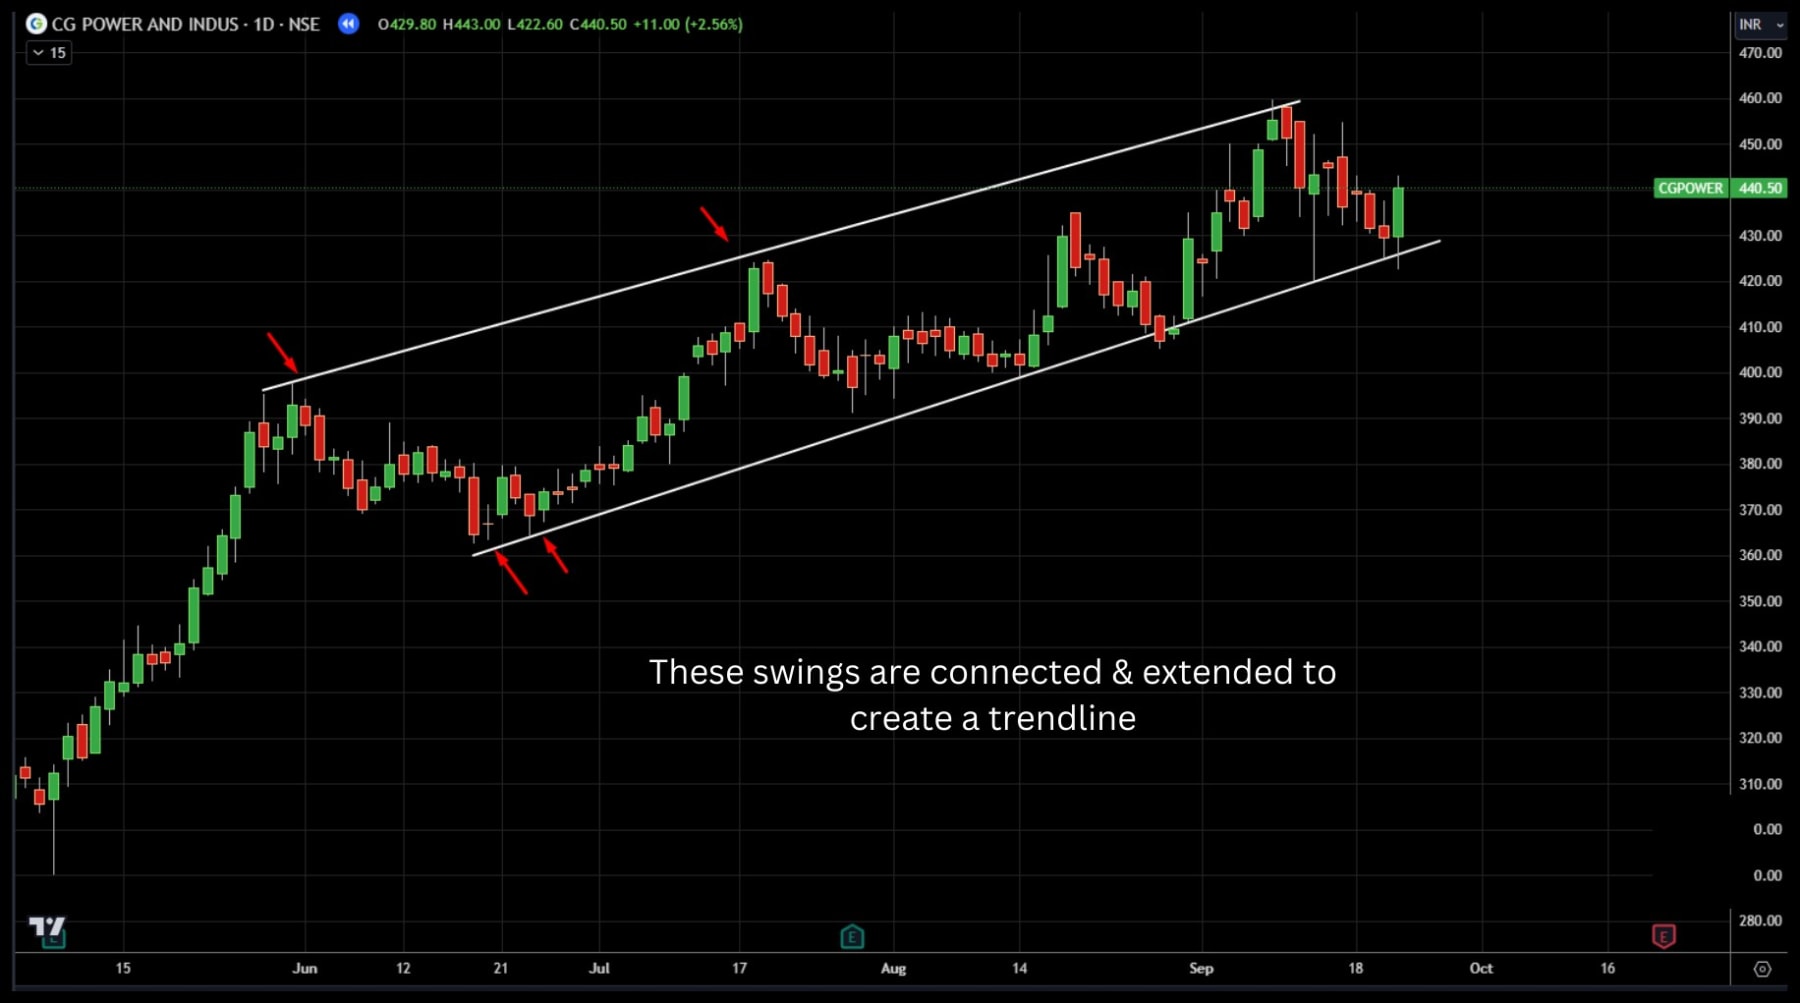
A trendline is a straight line drawn between two or more price points to identify and confirm a trend. In a trending market it connects the swing lows (in an uptrend) or the swing highs (in a downtrend), then extends into the future so you can see where price is likely to react next.
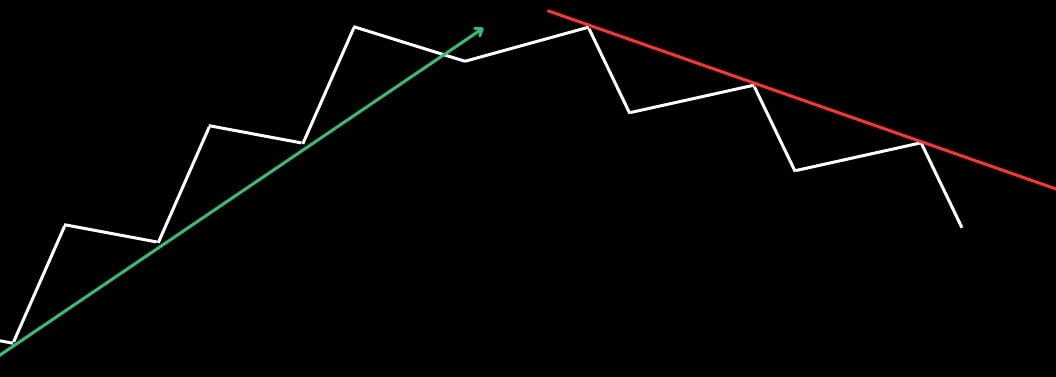
What does a trending market look like?
Before you draw anything, make sure there is a trend to draw. Trendlines only make sense when the market is clearly moving in one direction.
- Uptrend: price makes higher highs and higher lows. Each pullback stops above the previous one.
- Downtrend: price makes lower highs and lower lows. Each bounce fails below the previous one.
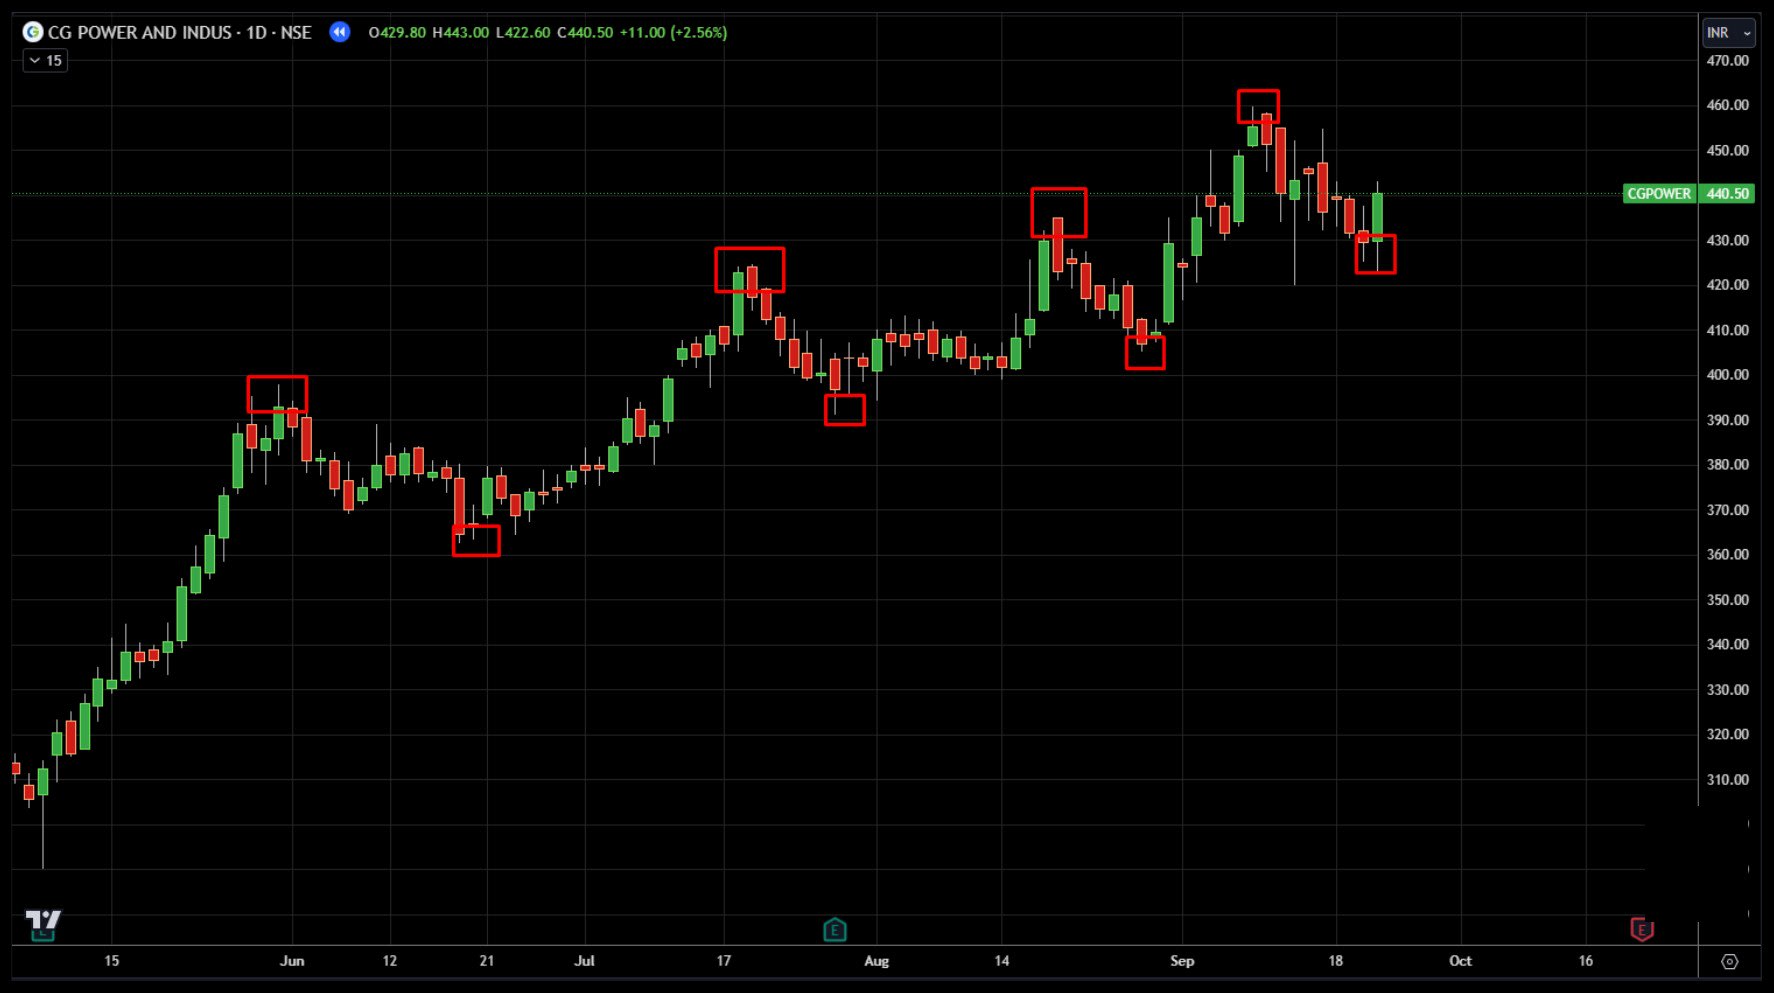
The same idea in reverse: a downtrend stepping lower, with each swing high failing below the last.
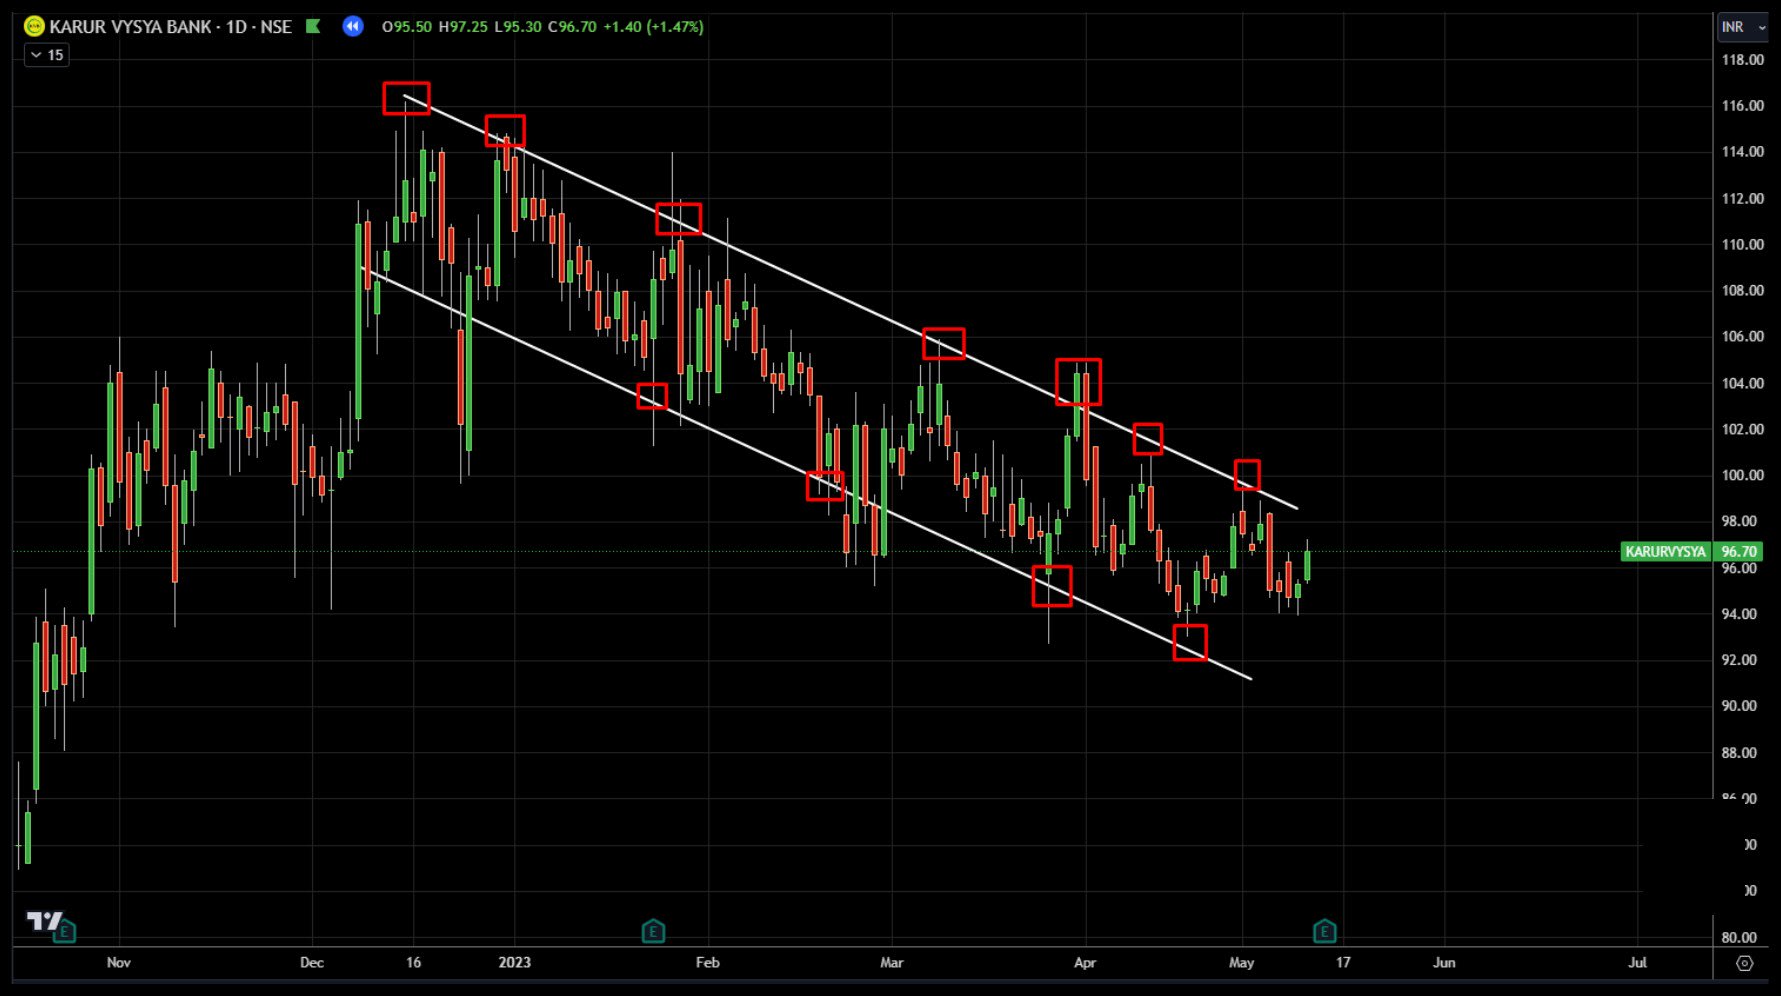
Once you can see the swings, you connect them and extend the line. That line becomes your trendline.
Why use trendlines?
Trendlines do two jobs:
- They act as dynamic support and resistance. Unlike a horizontal level, a trendline moves with price, so it shows you where buyers or sellers are likely to step in as the trend develops.
- A break can warn of a trend change. When price closes decisively through a trendline that held for a long time, the trend may be ending.
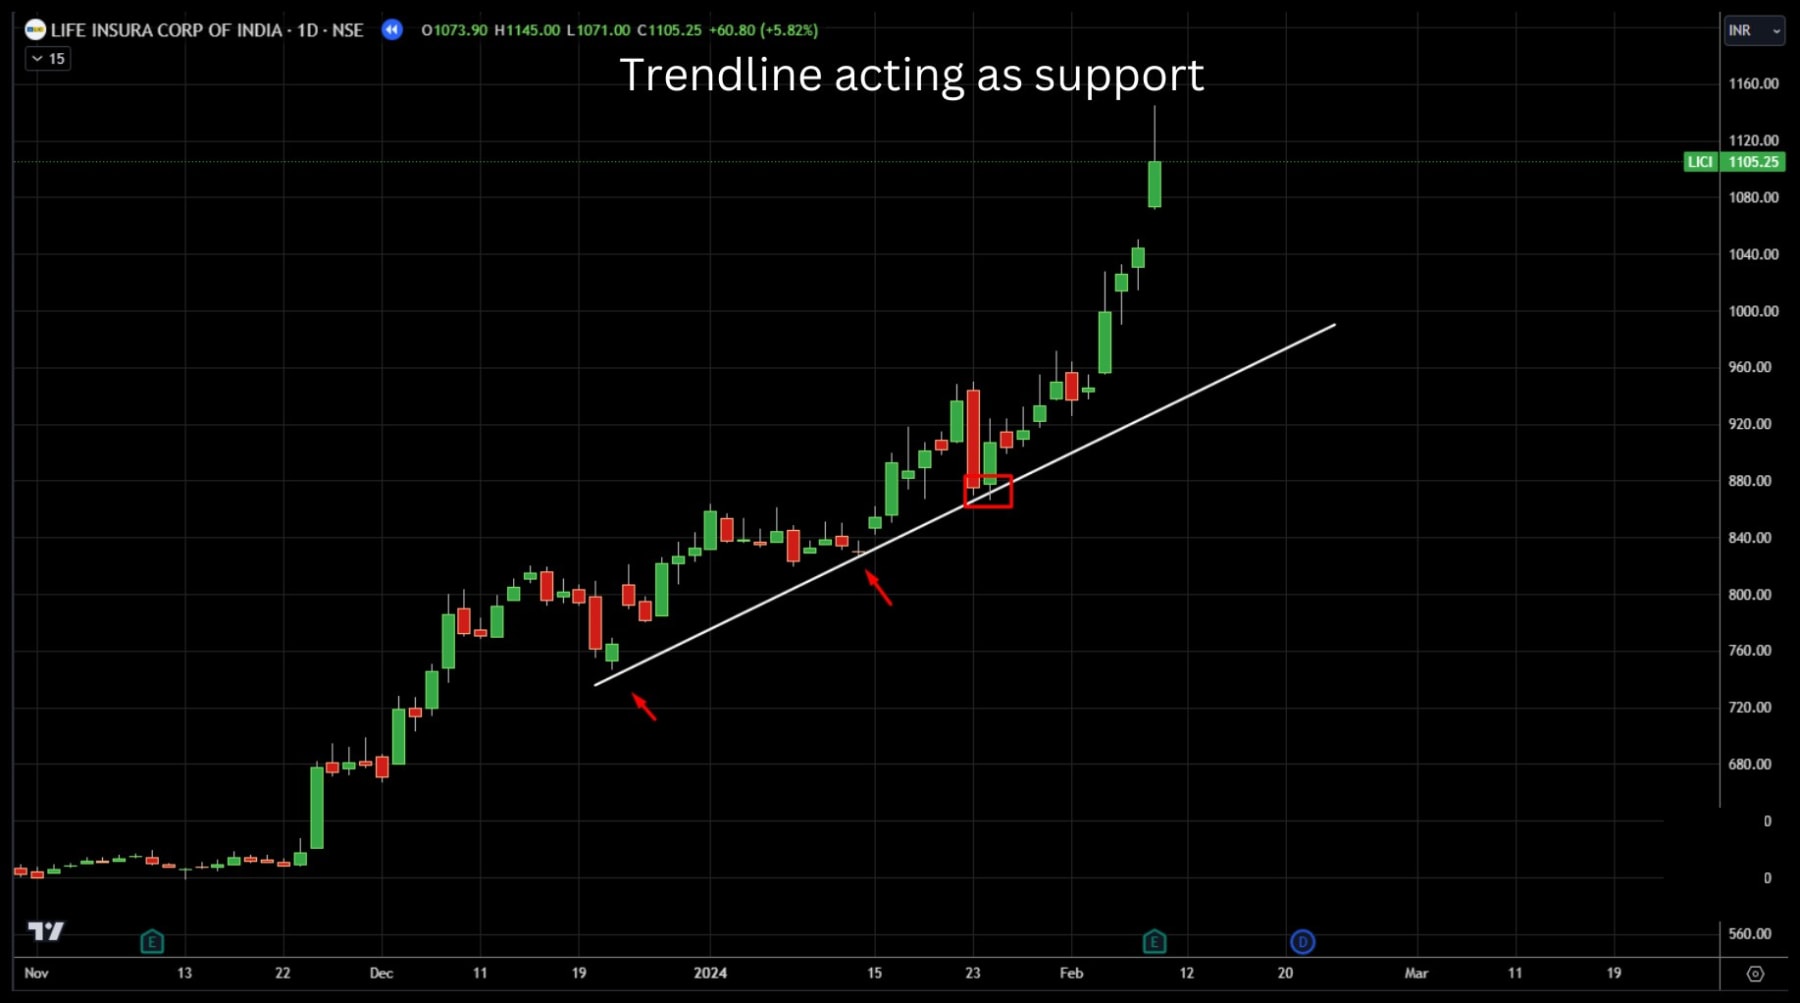
Trendline acting as support
In an uptrend, a rising trendline catches pullbacks. Each time price dips into it, buyers defend it and the trend continues.
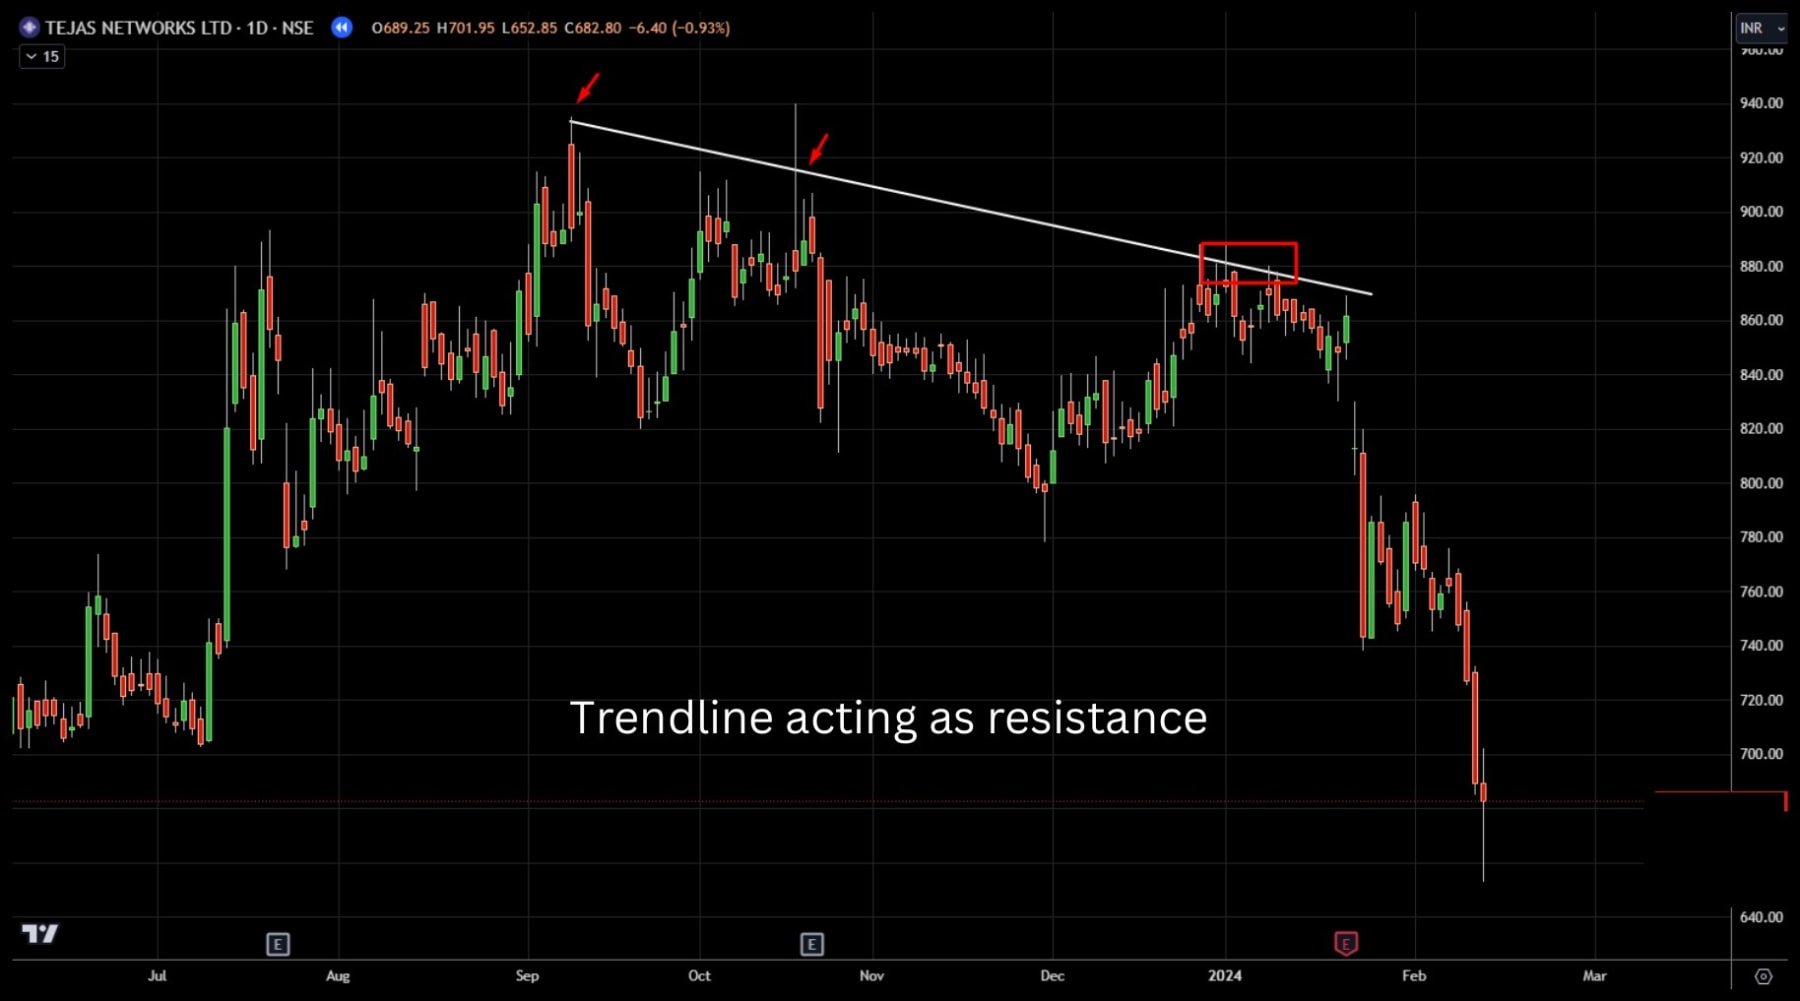
Trendline acting as resistance
In a downtrend, a falling trendline caps rallies. Each bounce into the line is sold, until the line finally gives way or price collapses from it.
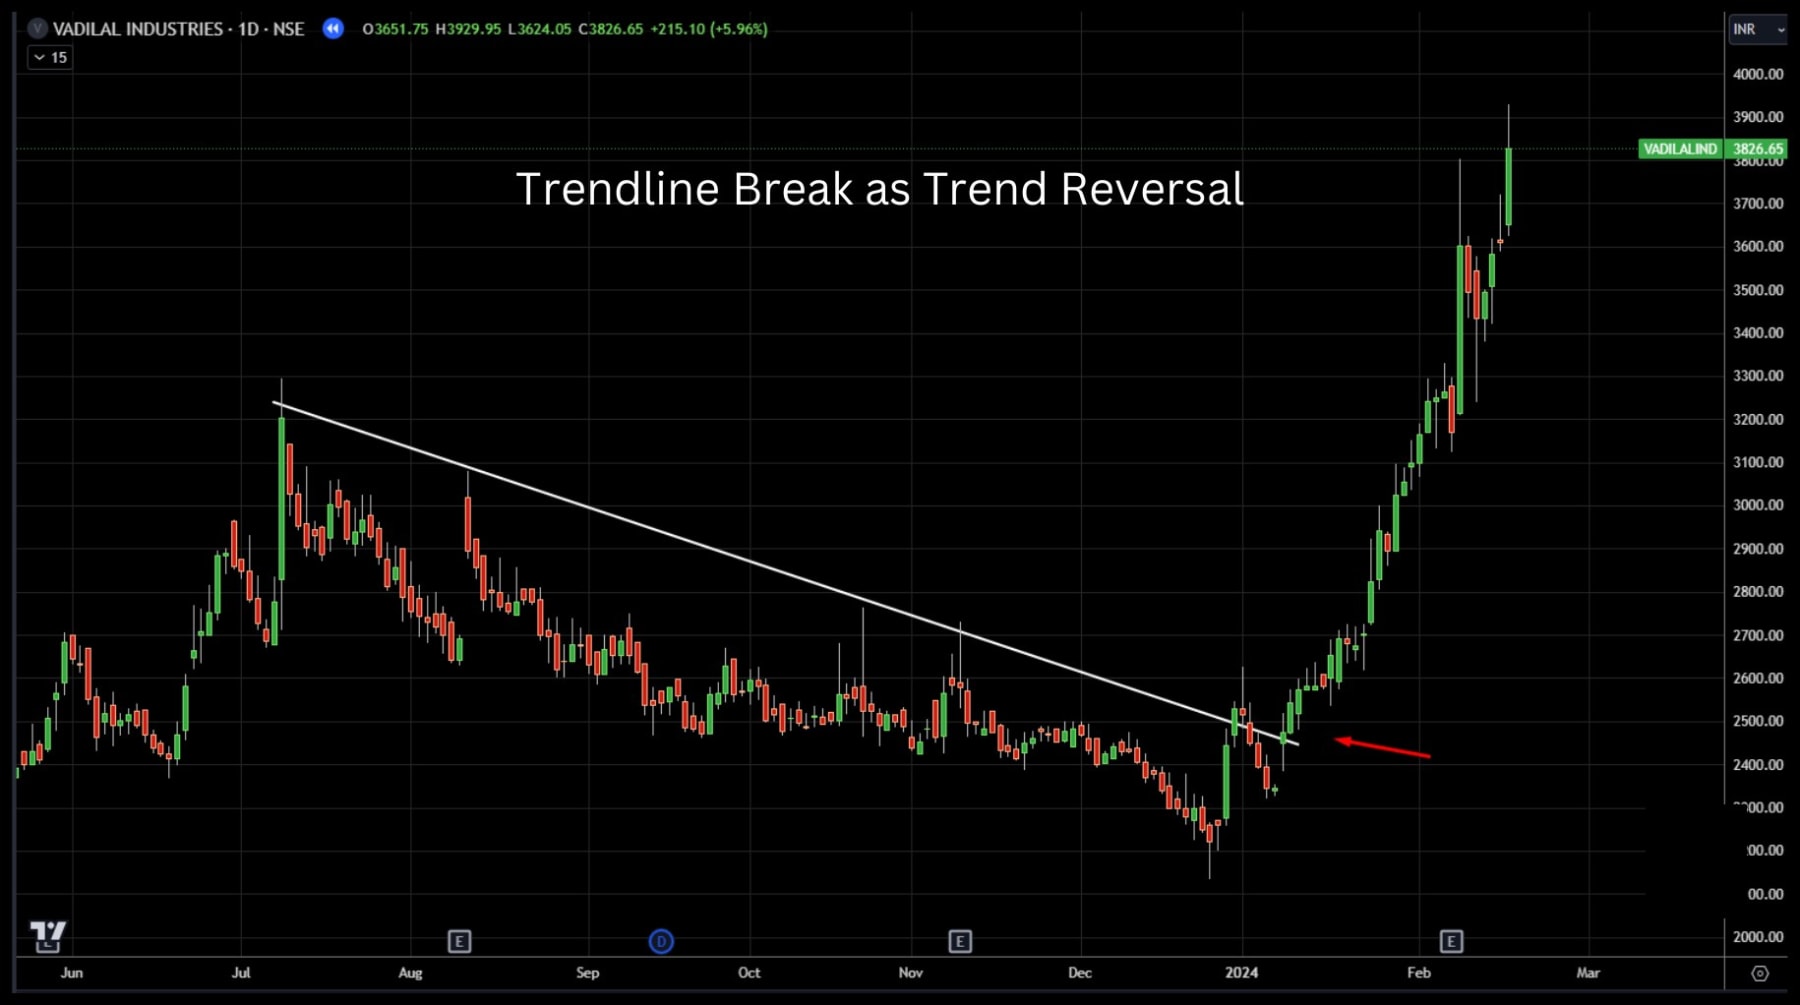
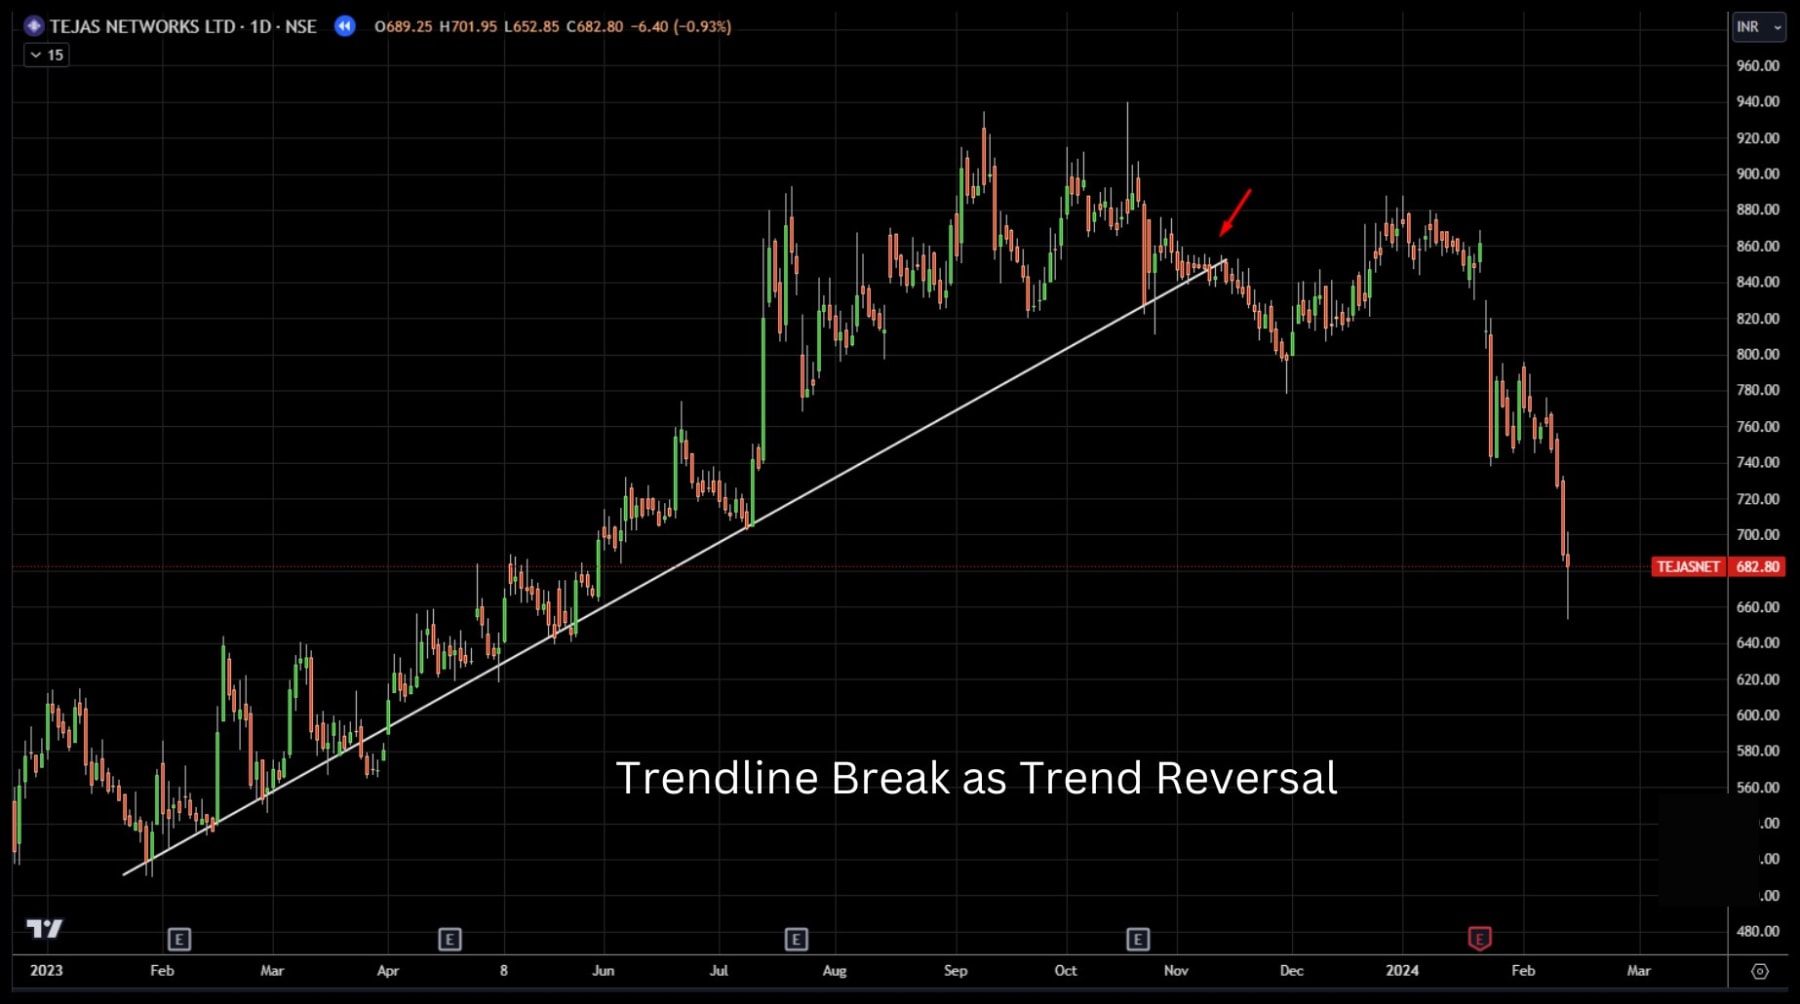
Trendline break as a trend reversal
When a falling trendline breaks, sellers have lost control. In this example, price broke above a long downtrend line and then rallied hard.
It works the same way at the top. Here a rising trendline that held for months finally broke, and the uptrend turned into a sharp decline.
A touch or a break on its own is not an entry signal. Recognising support, resistance or a trendline break tells you where to pay attention, not when to buy or sell. You still need other factors to line up before you take a trade.
4 rules for drawing a trendline
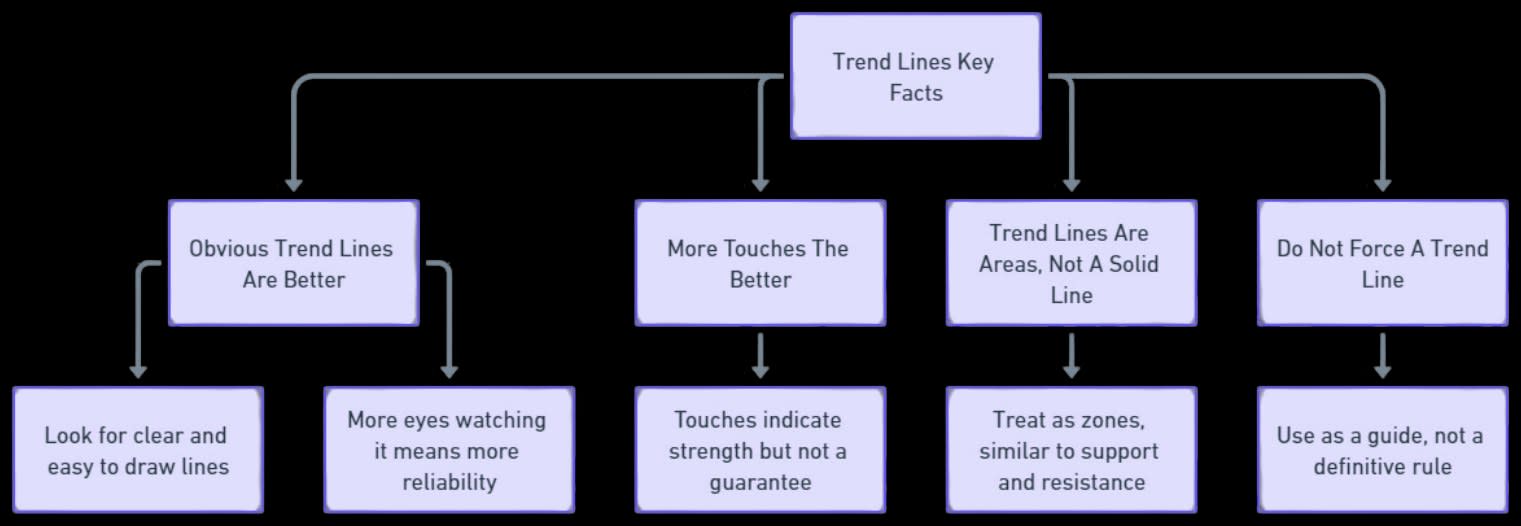
1. More touches make a better line
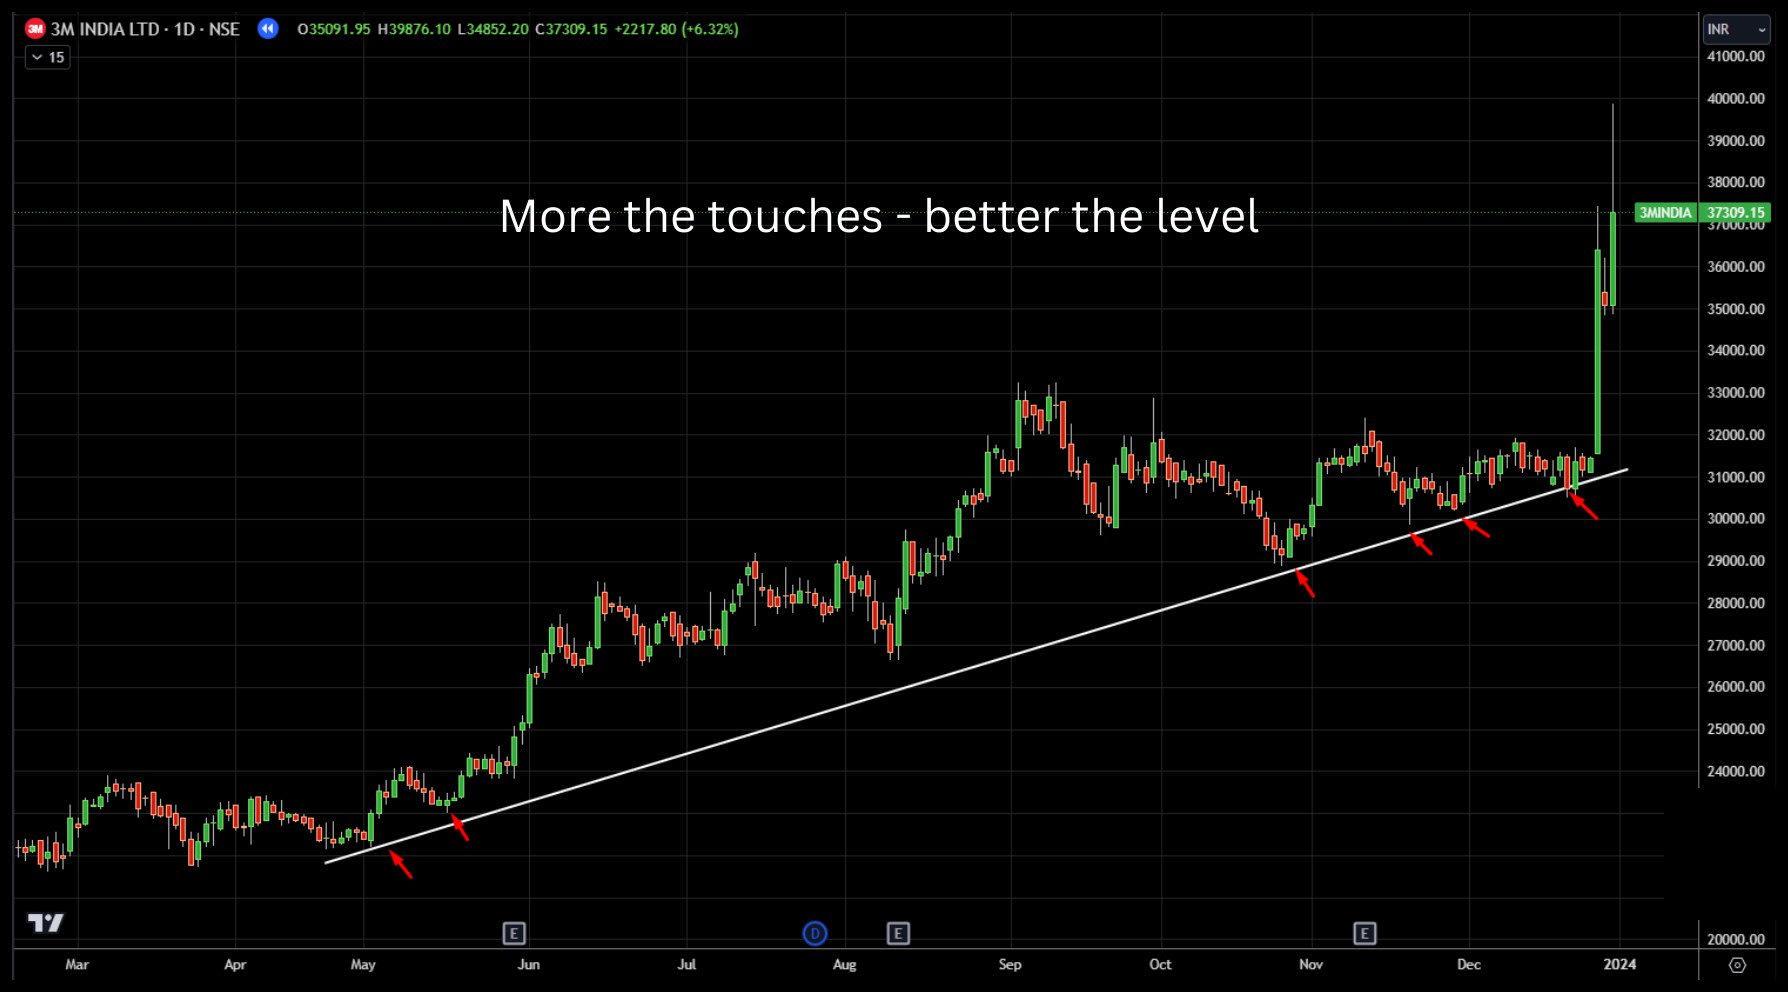
Two points make a line, but three or more touches make a trendline worth trusting. Every extra reaction shows that more traders are watching it. Touches add strength, but they are never a guarantee.
2. The line should be obvious
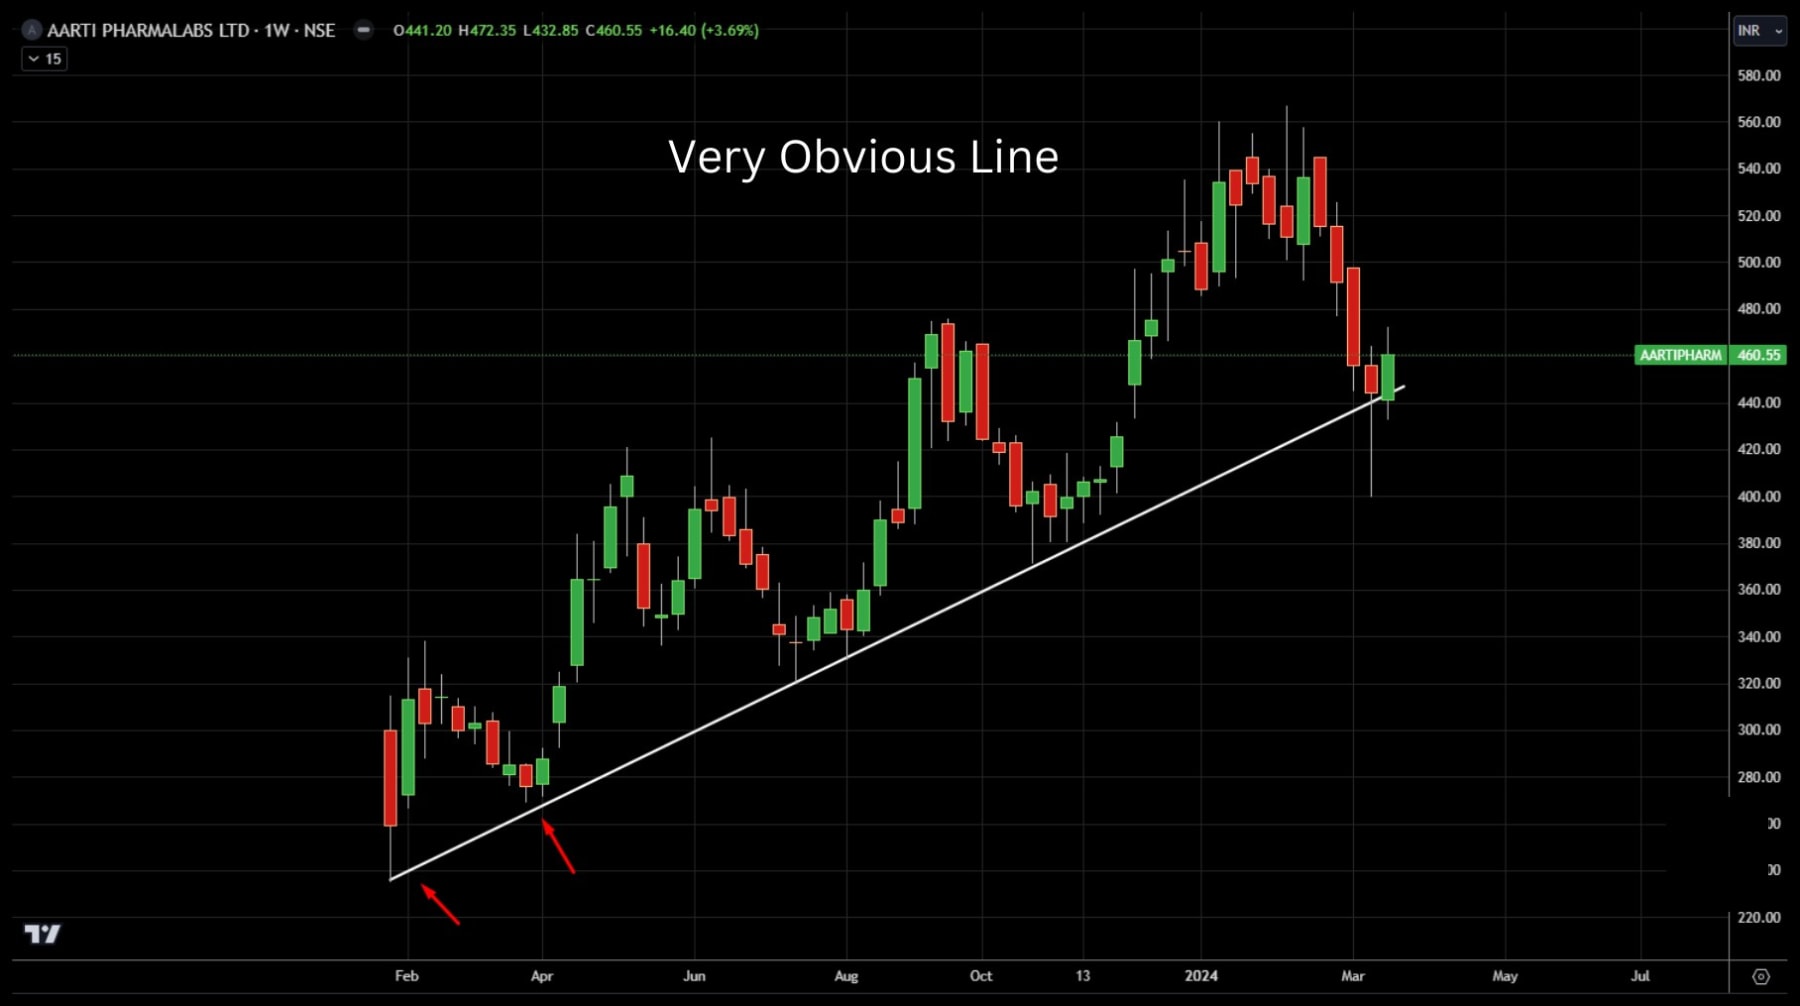
The best trendlines are clear and easy to draw. If you can see the line at a glance, so can thousands of other traders, and that shared attention is what makes it work.
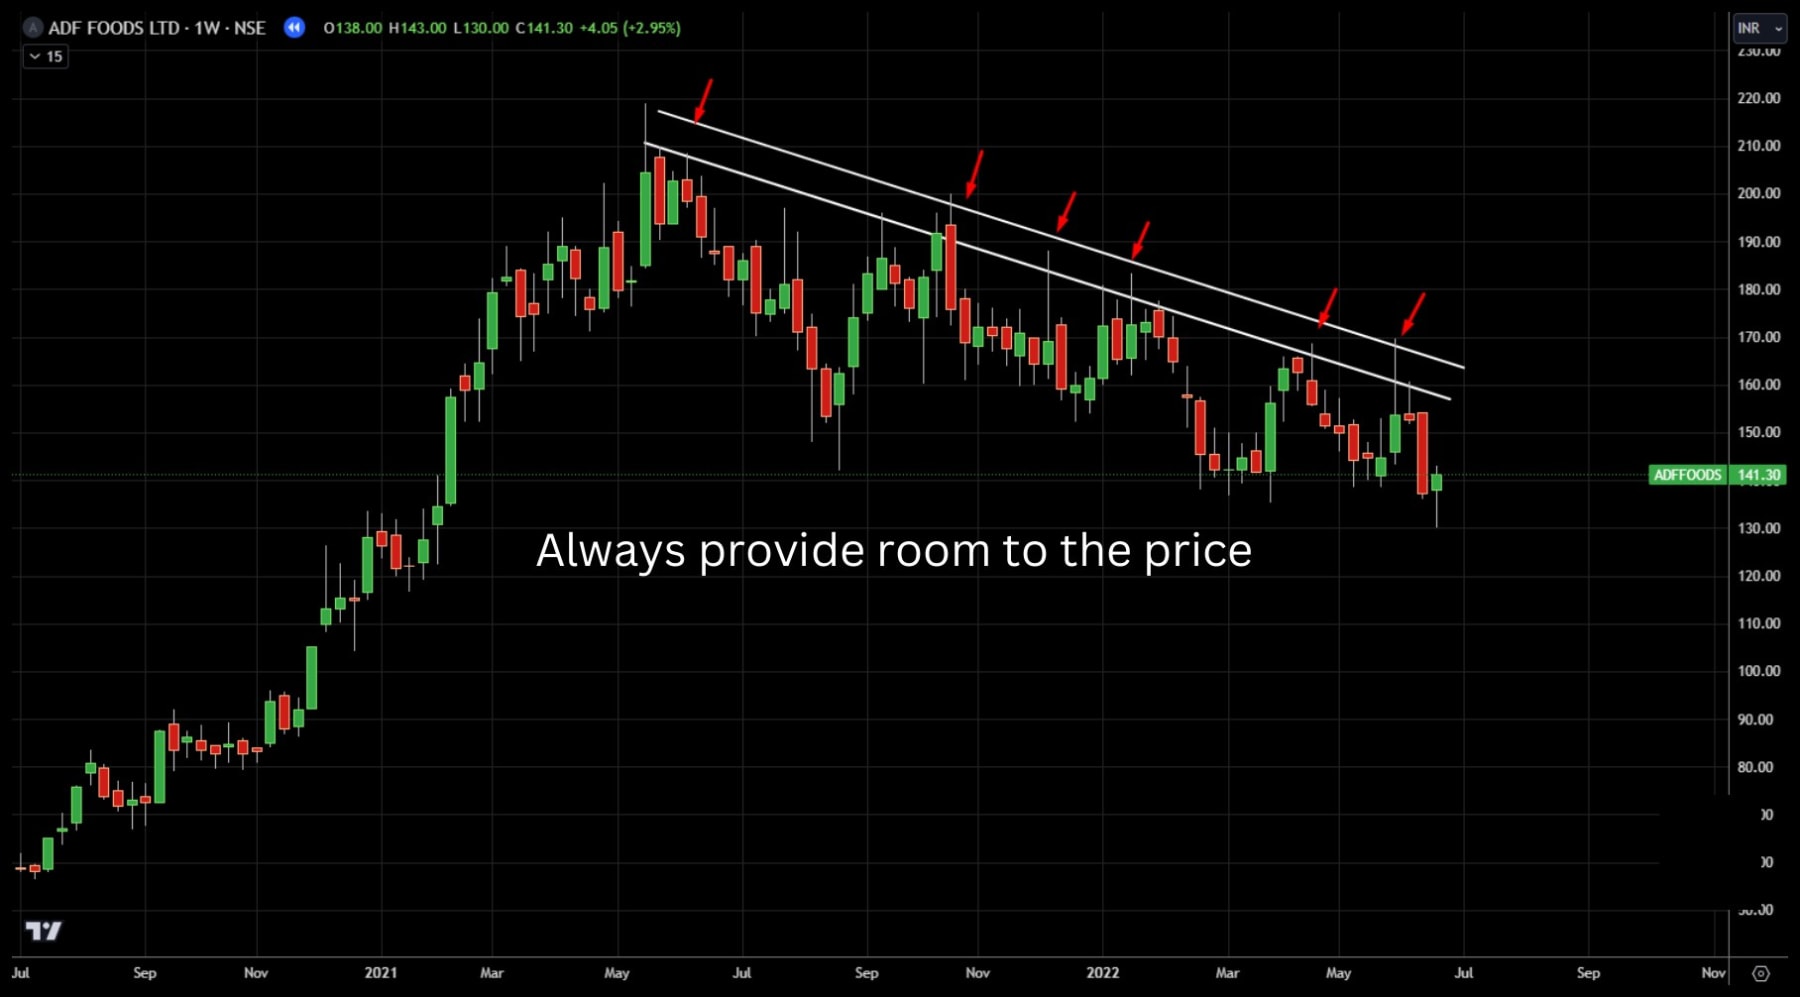
3. Give price some room
Price rarely respects a line to the exact tick. Wicks poke through, and some candles close slightly beyond it. Treat a trendline as a zone, much like support and resistance, rather than a razor-thin wire. Drawing a second parallel line to create a band often helps.
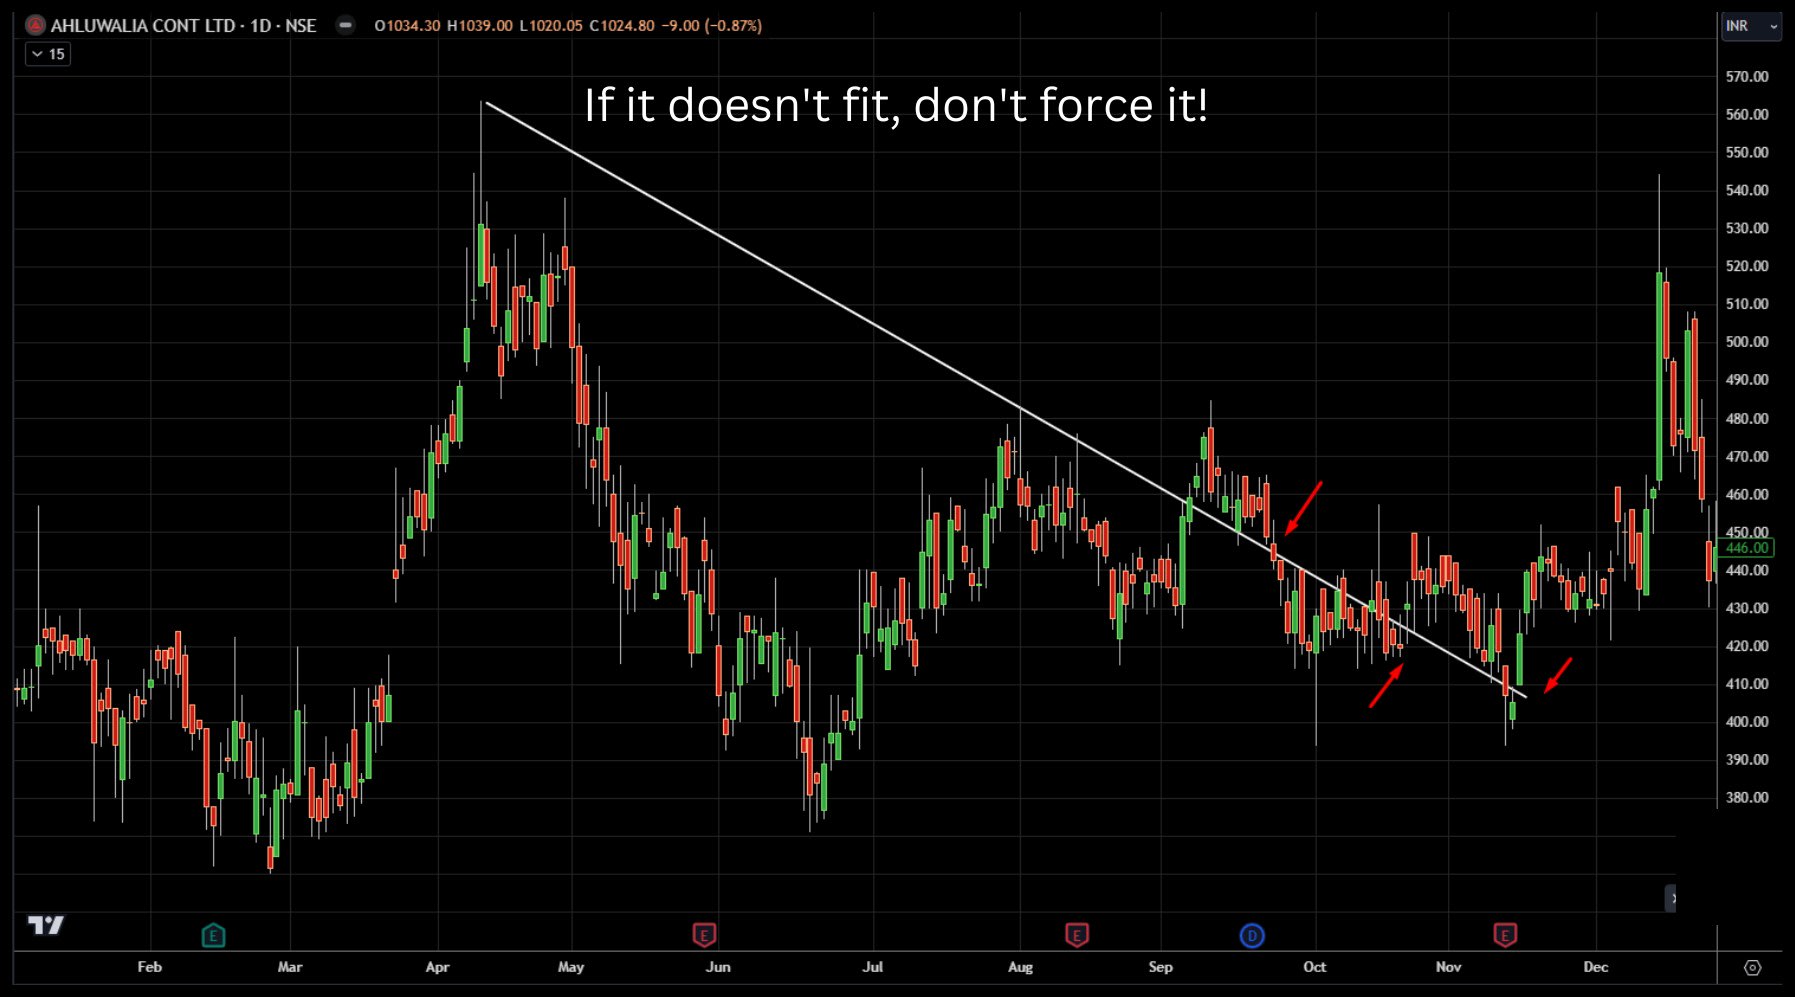
4. If it doesn't fit, don't force it
If you have to cut through a lot of candle bodies or ignore obvious swings to make your line work, it isn't a real trendline. Use trendlines as a guide, not a rule you bend the chart to fit.
How to trade using trendlines
There are two main ways to trade trendlines, and both can be done on a single timeframe or across multiple timeframes:
- Continuation trades go with the trend, entering as price pulls back to the trendline.
- Reversal trades go against the trend, entering after the trendline breaks.
Continuation trades
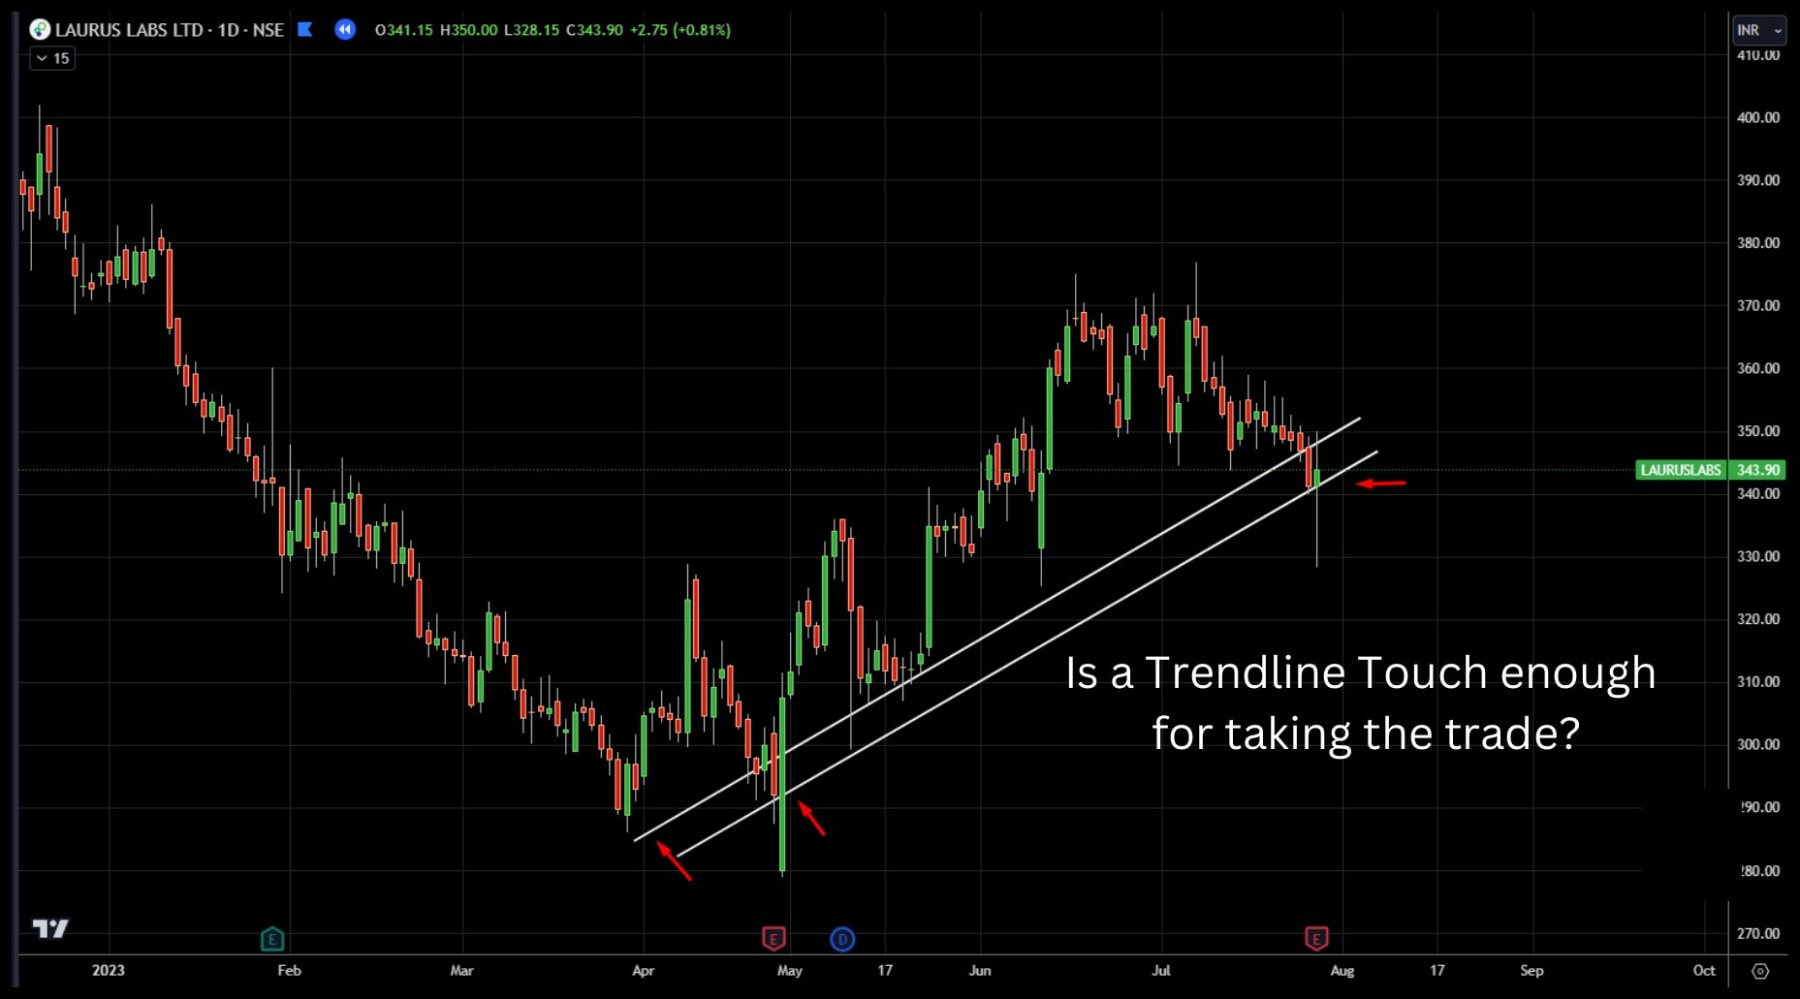
A continuation trade follows the main trend. You wait for price to pull back into the trendline and only enter when several price factors line up at the same spot: horizontal support or resistance, a price pattern, a strong candlestick and, of course, the trendline itself.
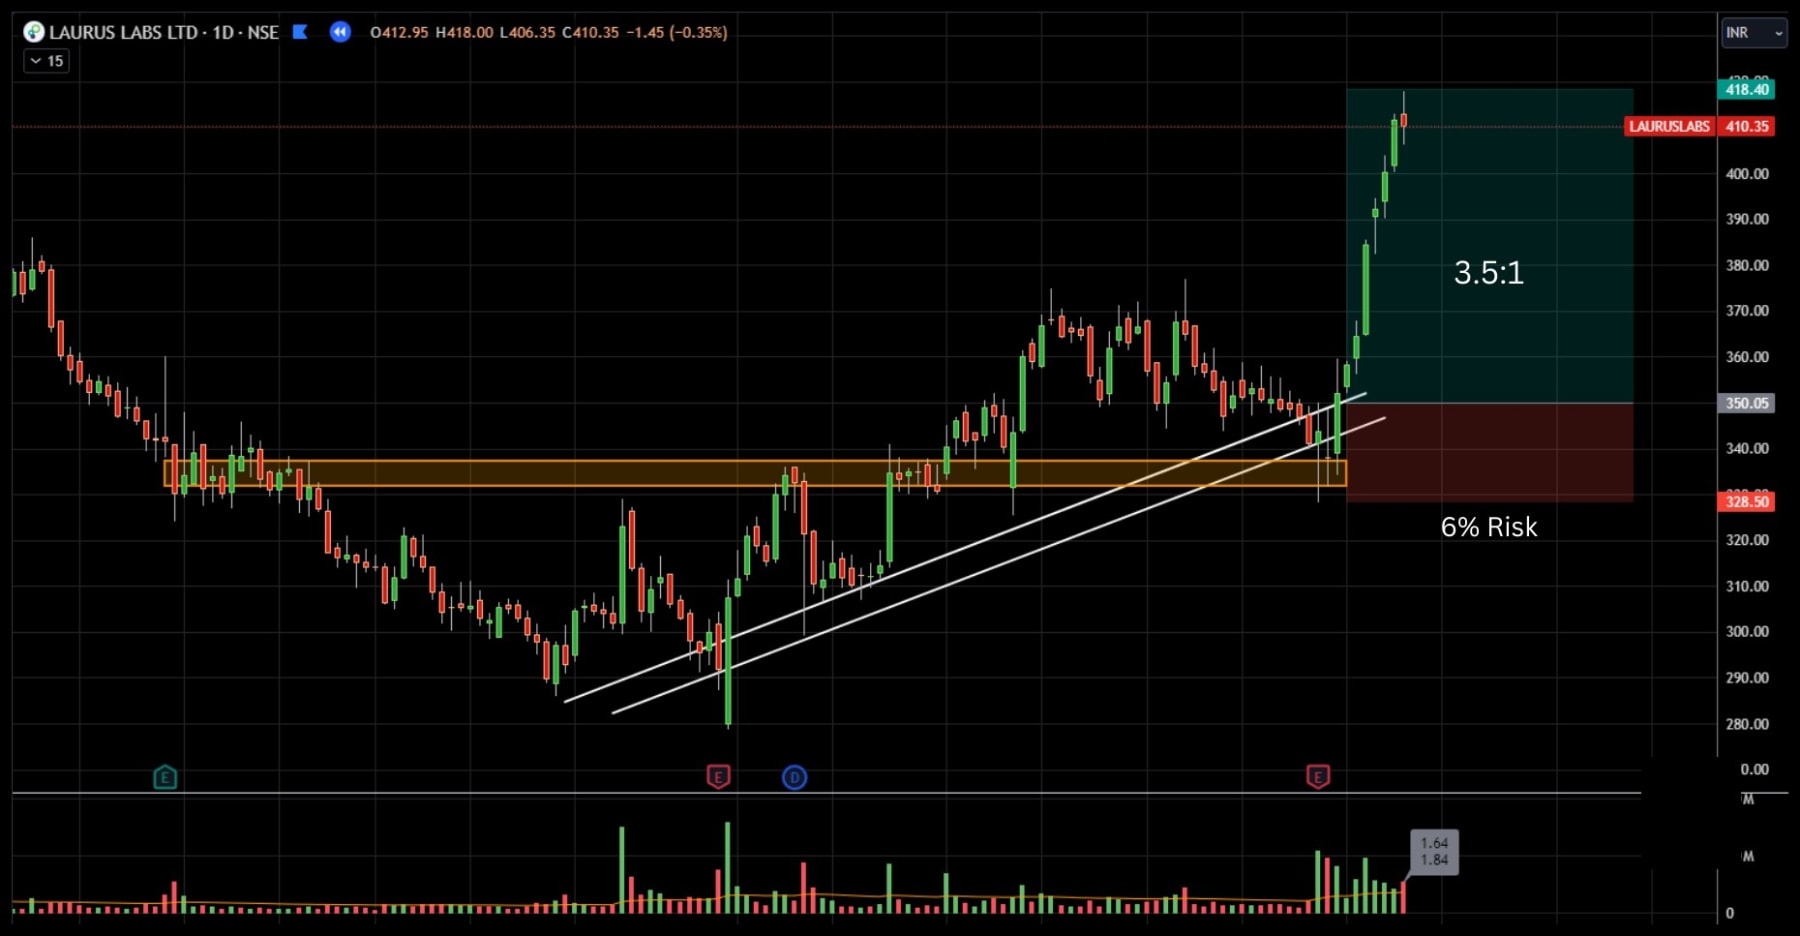
So is a trendline touch alone enough to take the trade? Look at the chart below. Price is pulling back into a rising trendline, but on its own that is just one reason.
Now look closer. At the same spot there is:
- Strong trendline support
- A swing zone where old resistance flipped to support
- A strong momentum candle (a hammer)
- Supporting volume
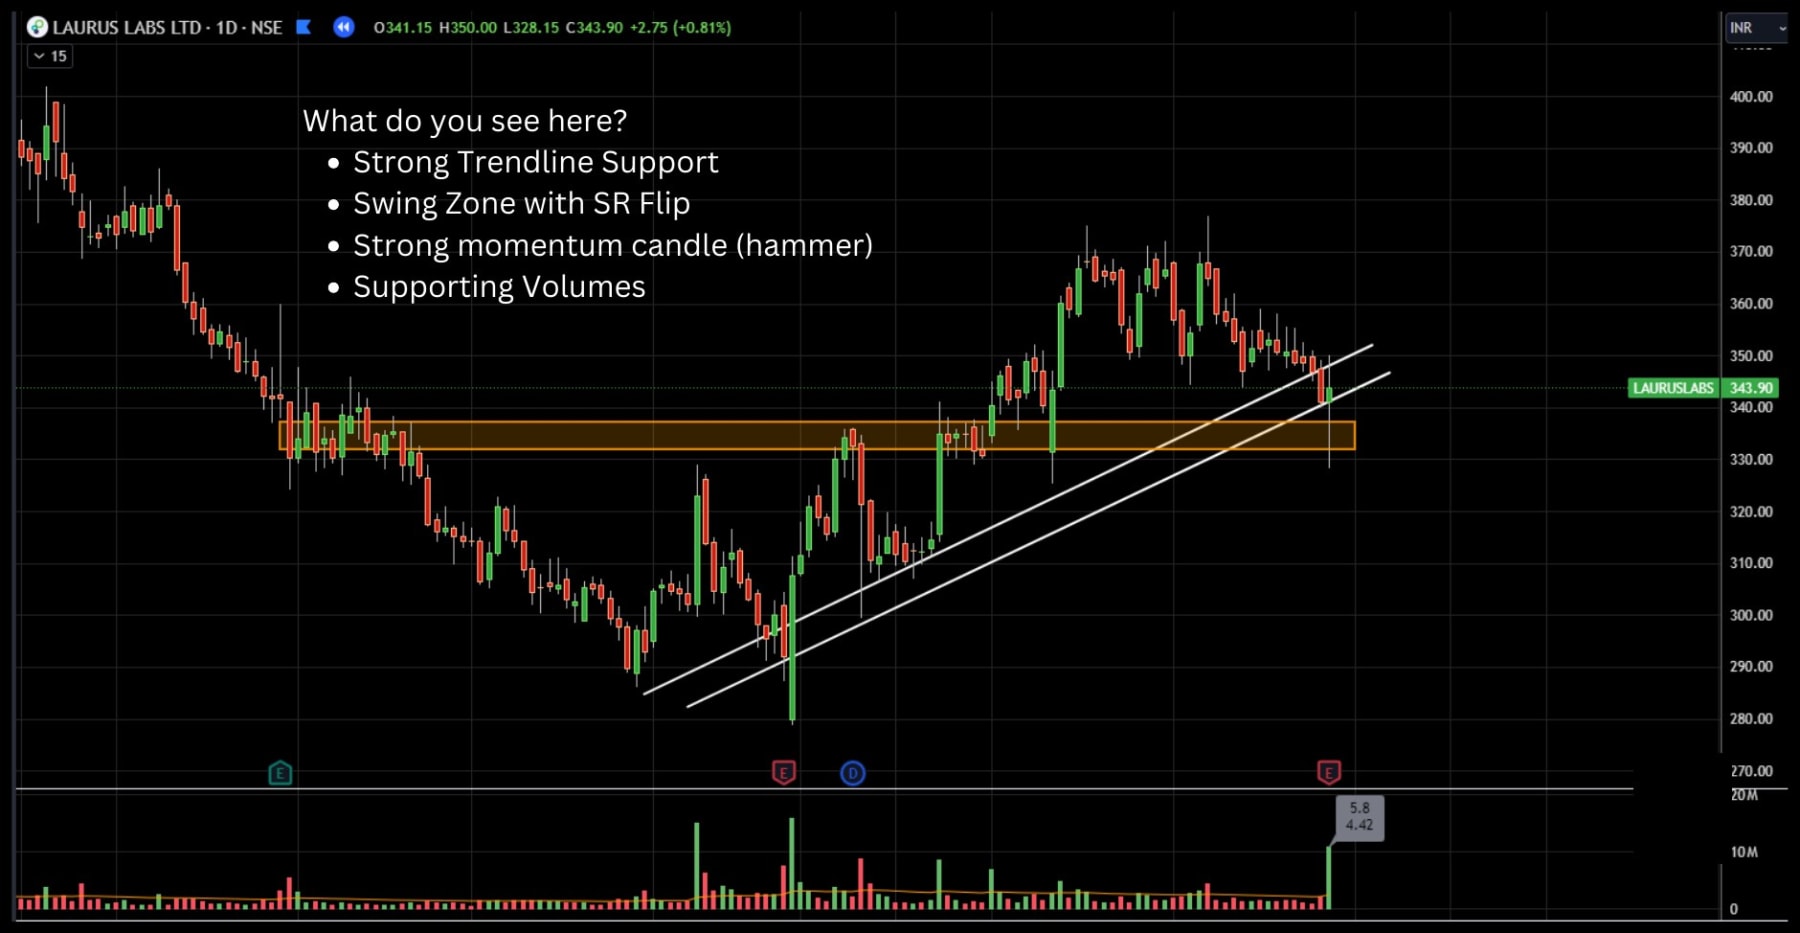
That stack of confluence is what turns a touch into a trade. With the stop below the zone, this setup paid roughly 3.5 times the risk.
Dropping to a lower timeframe can refine it further. On the hourly chart, a small falling trendline inside the pullback broke right at the zone, giving a tighter entry and stop and improving the payoff to about 4.55 to 1.
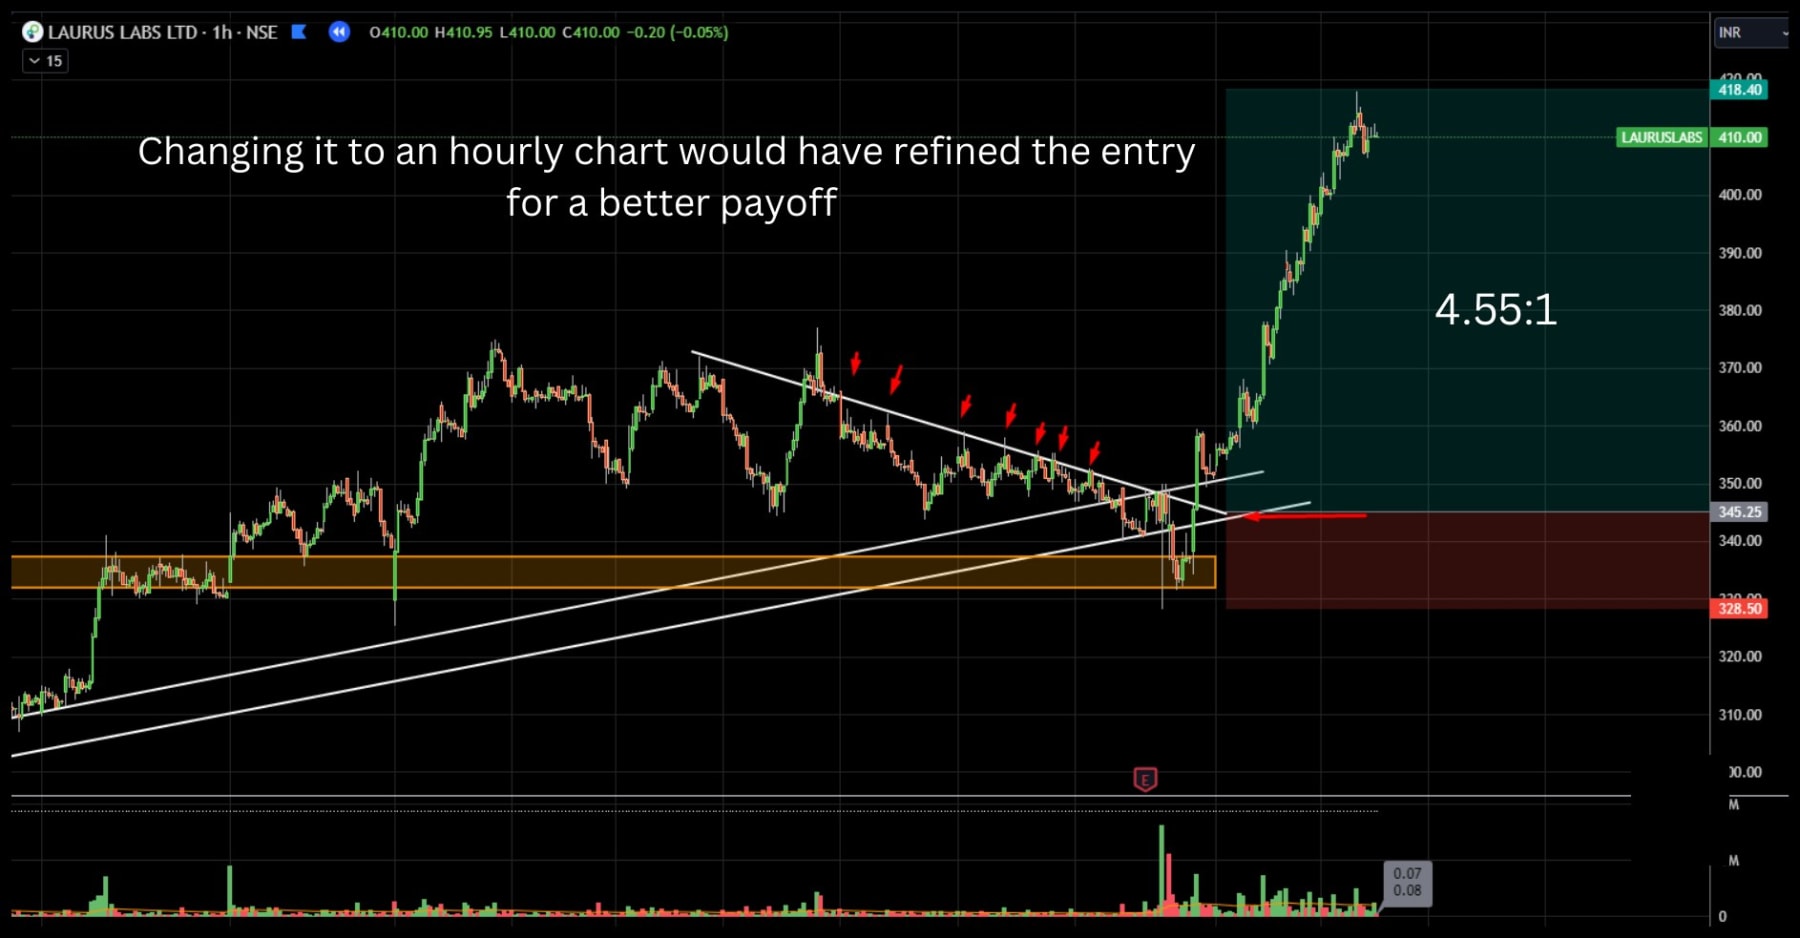
Multi-timeframe tip: use the higher timeframe to find the trend and the zone, then use the lower timeframe to time the entry. A tighter stop on the same idea means a bigger reward-to-risk ratio.
Reversal trades
Reversal trades go against the prevailing trend. They are triggered by a trendline break in anticipation of the trend changing direction. Because you are fighting the trend, you need more evidence: the trendline break, nearby support and resistance, volume, price patterns and candlestick signals.
Here, price formed a double top and then broke the rising trendline. Two signs pointing the same way.
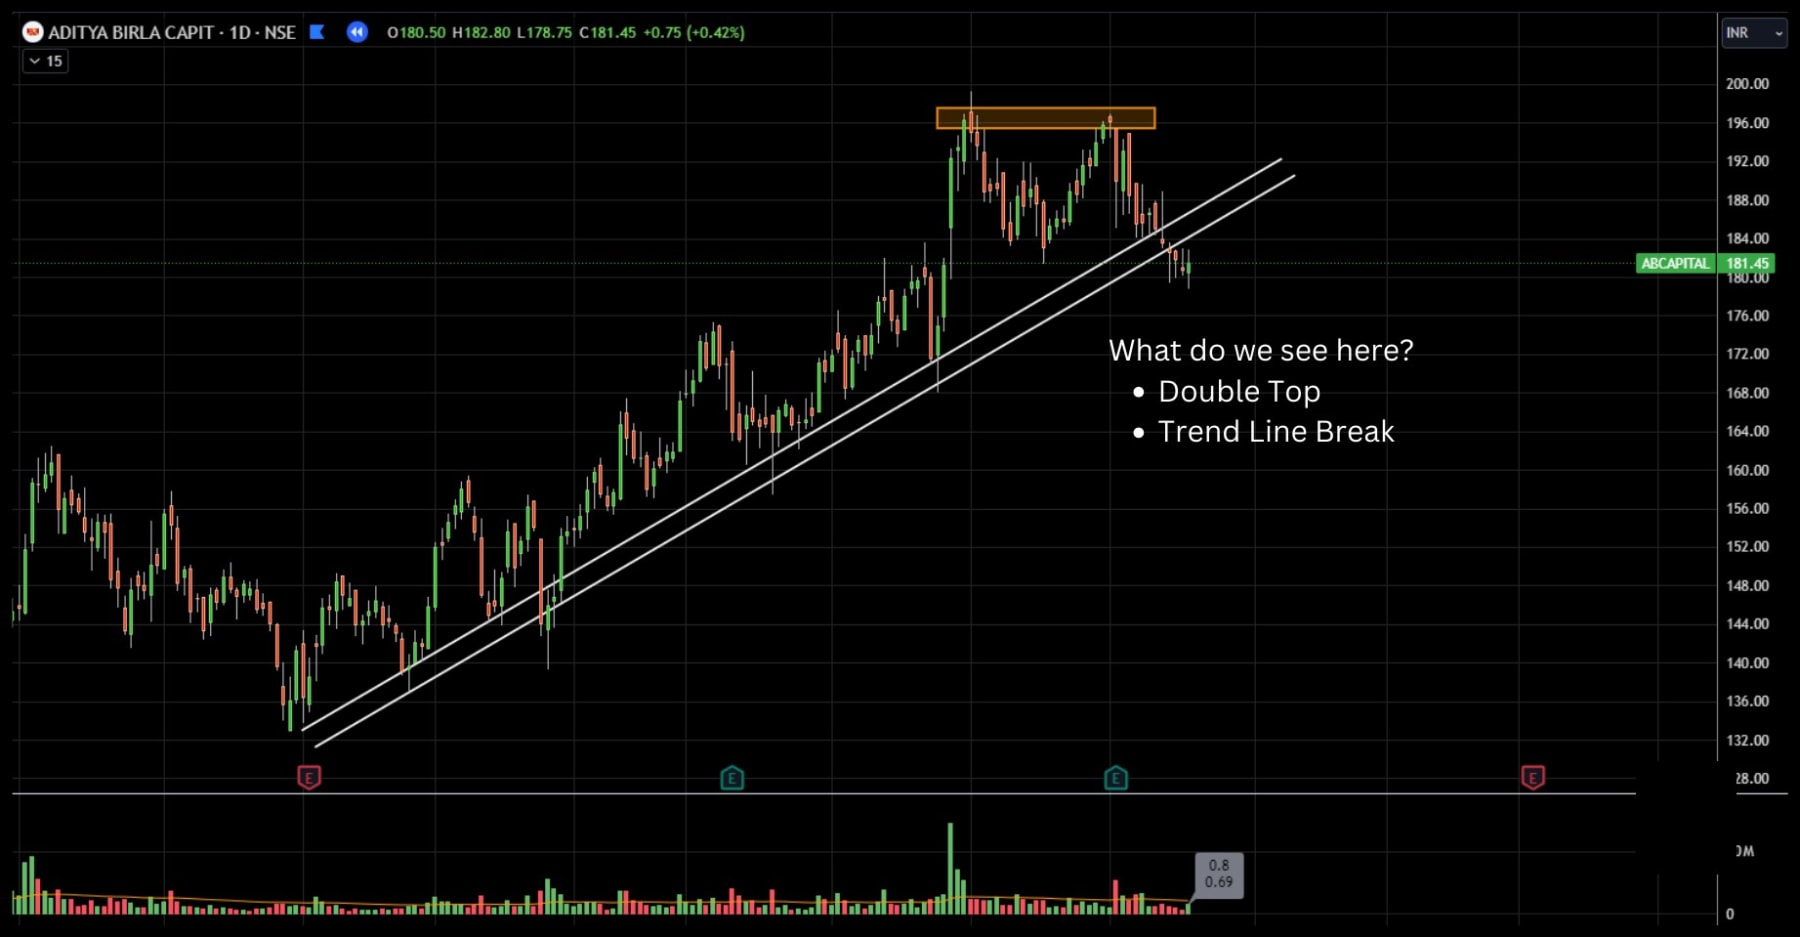
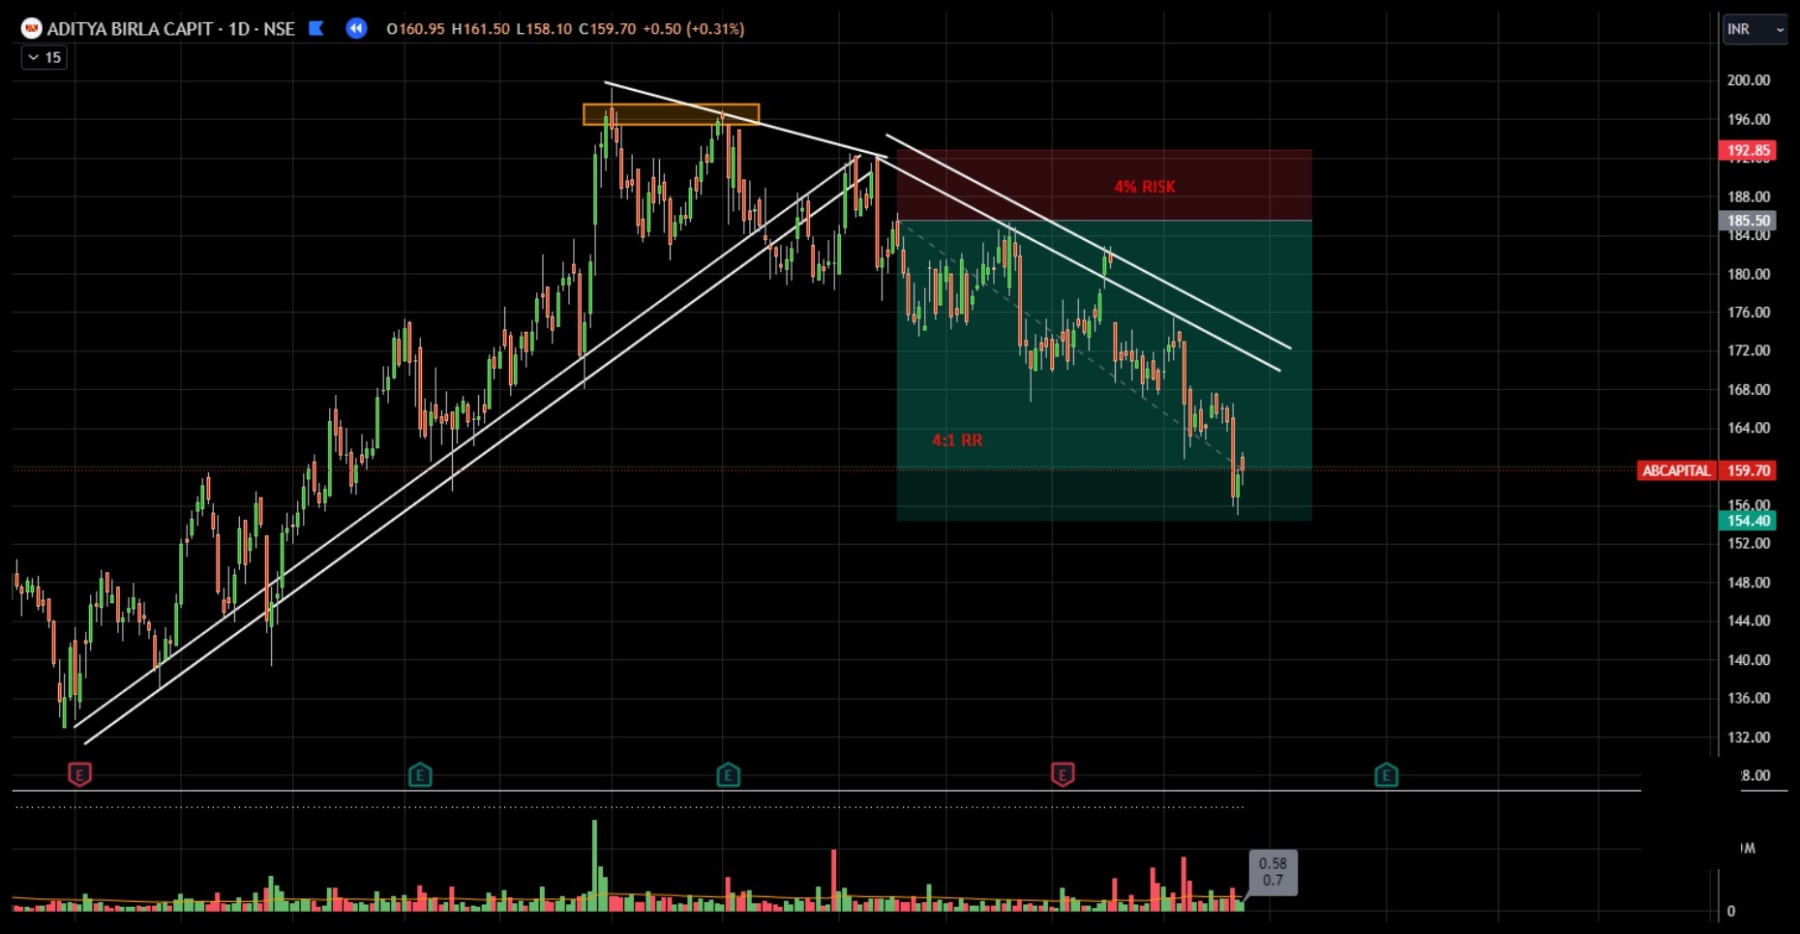
When taking a reversal trade, always look for an extra layer of confirmation. In the next chart, price is making lower tops, a new falling trendline has formed, and the old support trendline has turned into resistance.
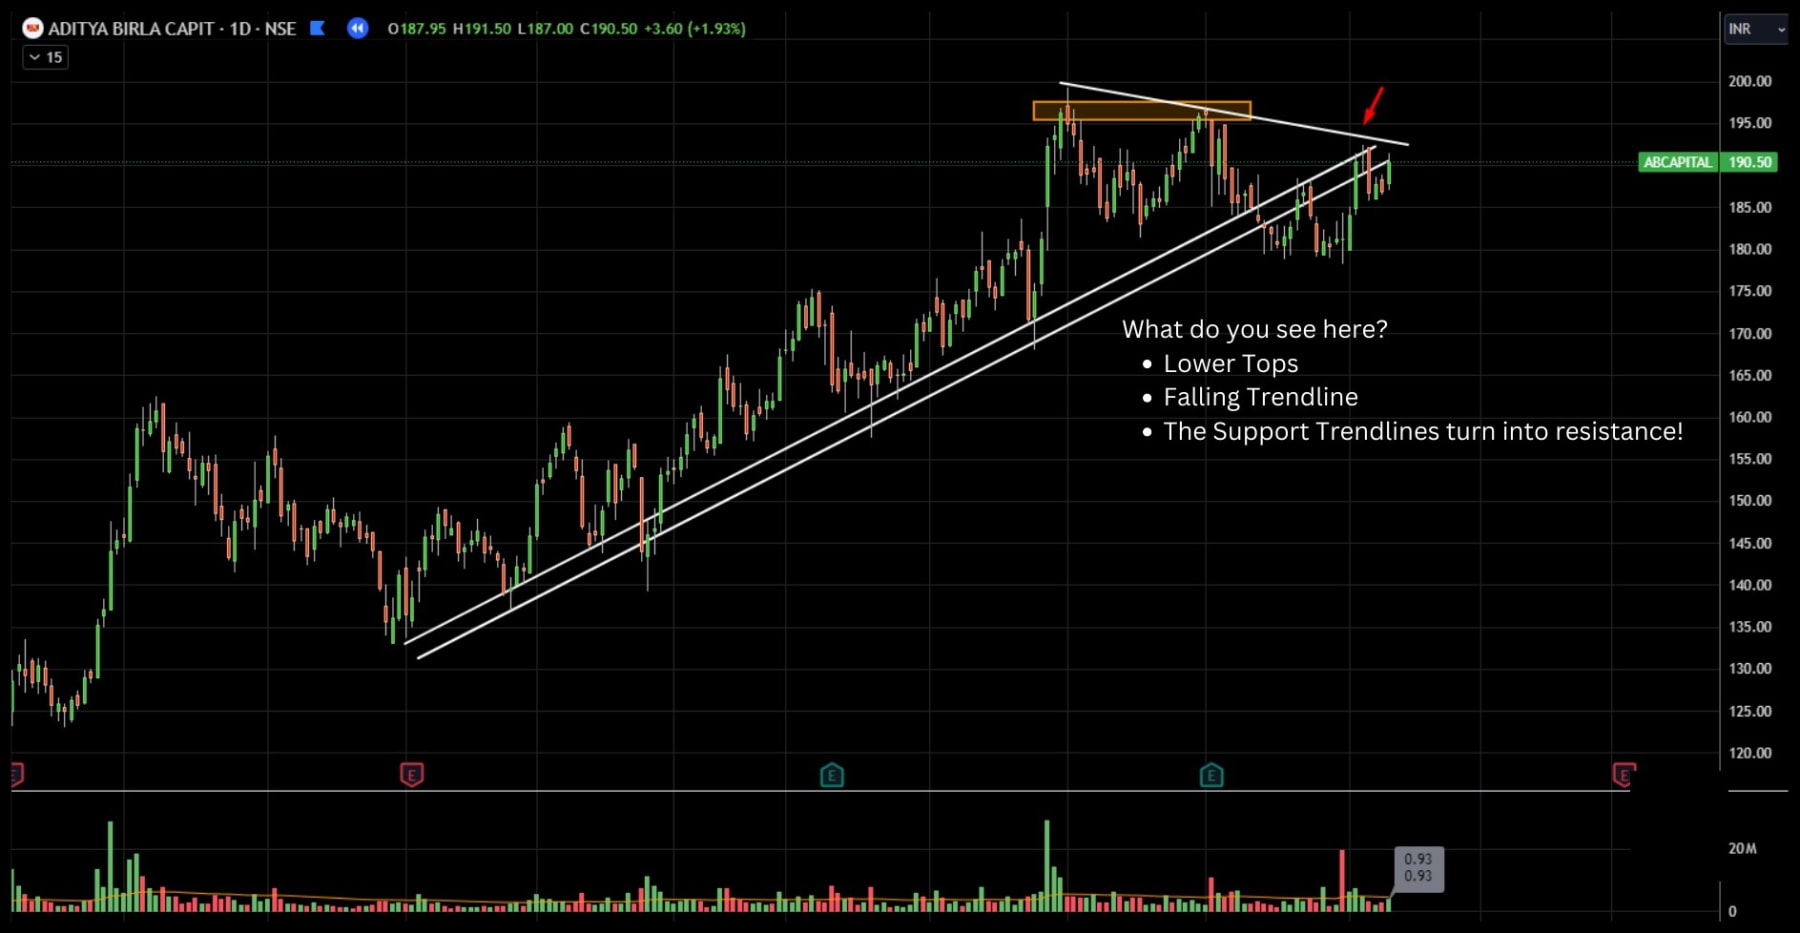
With all of that lined up, the short trade played out cleanly, with the stop above the recent top and the target well below.
Common trendline mistakes
- Drawing trendlines in a sideways market where there is no trend.
- Forcing a line through candle bodies to make it fit.
- Expecting price to turn at the exact line instead of giving it room.
- Entering on every touch without any other confirmation.
- Shorting the first small break of a strong uptrend without extra signals.
Track your trendline trades in ETW Journal
To find out which trendline setups work for you, log them. In ETW Journal, tag each trade as a trendline continuation or trendline reversal, note the confluence you saw (S/R flip, candle pattern, volume, timeframe used for entry) and attach a screenshot of the line you drew. After a few weeks your stats will show which combinations actually pay, and you can replay and backtest the same rules before risking real money.
Charts in this guide are from Bharat Jhunjhunwala's (CMT, CFTe, MFTA) presentation “Trend Lines Price Action”.