 ETW

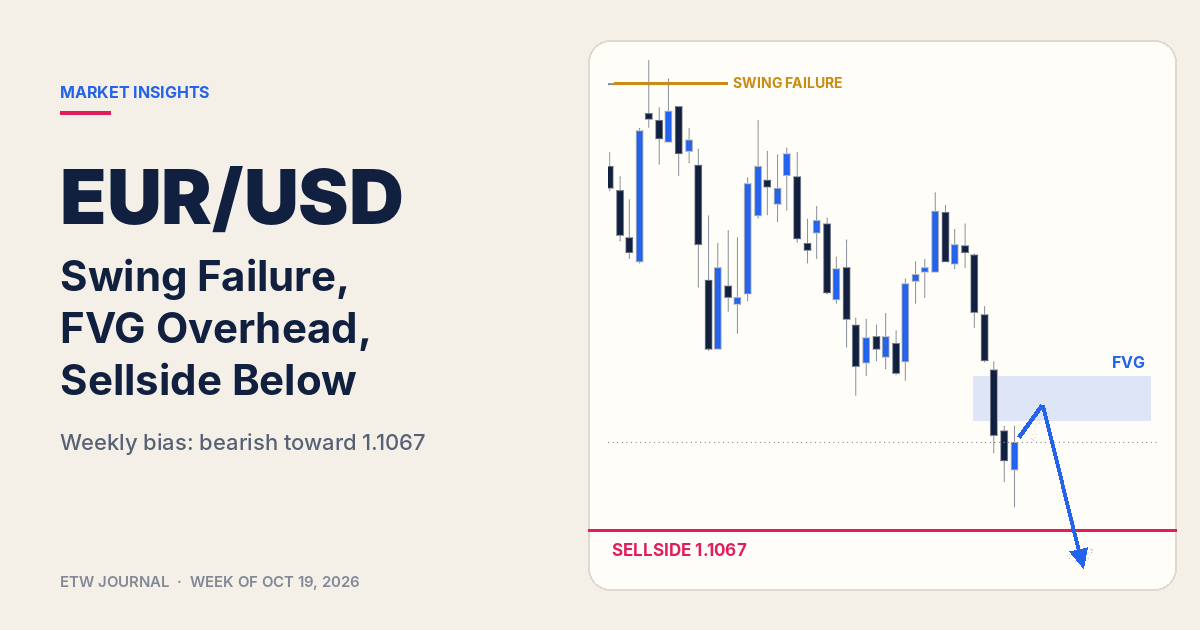
EUR/USD has turned decisively bearish on the weekly chart. A swing failure at the highs started the decline, and the latest sell-off left a bearish fair value gap (FVG) just above current price. Our plan for next week: look for a retrace into that FVG, then a continuation lower toward the sellside liquidity at 1.1067.
Here is the full breakdown.
What the weekly chart shows
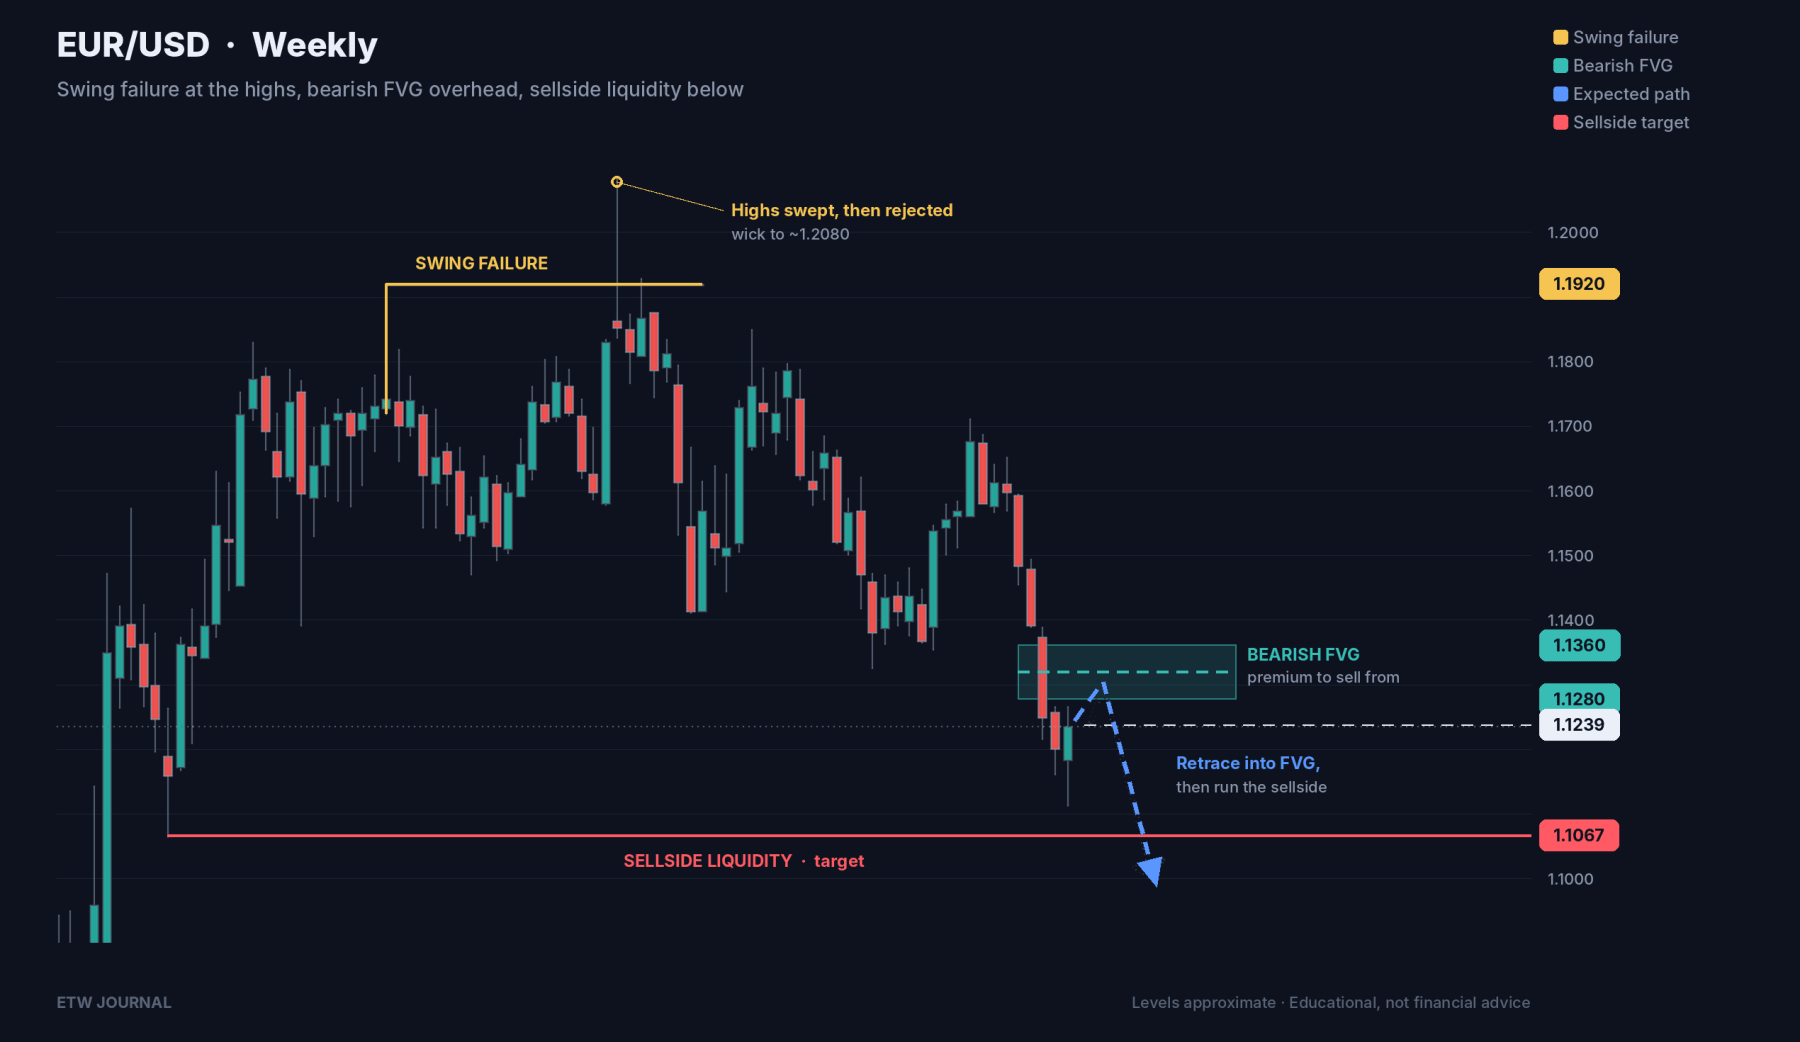
For months, EUR/USD ranged below a weekly swing high around 1.1920. Price eventually spiked above it, wicking as high as roughly 1.2080, but it couldn't hold. The weekly candles closed back below the old high: a classic swing failure. The breakout buyers were trapped.
Since then the pair has made lower highs and lower lows. The most recent leg down was fast and strong, and it left a gap between roughly 1.1280 and 1.1360. Price is now trading around 1.1239, just below that gap.
Why the swing failure matters
A swing failure happens when price trades beyond a previous high but fails to close and hold above it. It tells us the move up was a liquidity grab, not real strength:
- Buy-stops above the high were taken. That liquidity gave larger players the orders they needed to sell into.
- The failed close trapped buyers. As price falls, their exits add fuel to the move lower.
- Order flow flipped bearish. Each weekly rally since has been sold, creating lower highs.
The bearish fair value gap: where sellers are likely waiting
A fair value gap is left when one candle moves so aggressively that the candles on either side don't overlap. In a downtrend, a bearish FVG becomes a premium zone: a place where price often returns before continuing lower.
- FVG range: about 1.1280 to 1.1360.
- Midpoint (consequent encroachment): about 1.1320. A rejection at or below this level is a sign of strong sellers.
Because price sold off so quickly, we don't want to chase it at the lows. The higher-probability idea is to let price retrace up into the FVG first, and then look for signs of rejection.
The target: sellside liquidity at 1.1067
Below the market sits the swing low at 1.1067. Stop-losses from traders who are long sit just under it. That pool of sell-stops is sellside liquidity, and it is the most obvious draw for price after a swing failure and a bearish FVG.
The expected path is simple: up into the FVG, then down through 1.1067.
The plan for next week
- Bias: Bearish while price stays below the FVG (below ~1.1360).
- Entry zone: A retrace into 1.1280–1.1360, ideally rejected around the 1.1320 midpoint.
- Target: Sellside liquidity at 1.1067.
- Confirmation: On the daily and 4H, wait for a bearish shift in structure inside the FVG before entering.
- Invalidation: A weekly close above ~1.1360 (through the FVG) would weaken the bearish idea and call for a fresh read.
No retrace? Strong trends don't always give you the pullback. If price heads straight for 1.1067 without touching the FVG, let it go and wait for the next setup instead of chasing.
Key takeaways
- EUR/USD put in a weekly swing failure above ~1.1920 and has been bearish since.
- A bearish FVG at 1.1280–1.1360 sits just above price and is the zone to watch for sells.
- The target is the sellside liquidity at 1.1067.
- Be patient: let price come to the FVG, and respect invalidation above 1.1360.
This analysis is for educational purposes only and is not financial advice. Trading forex involves substantial risk. Always manage your risk and do your own research.